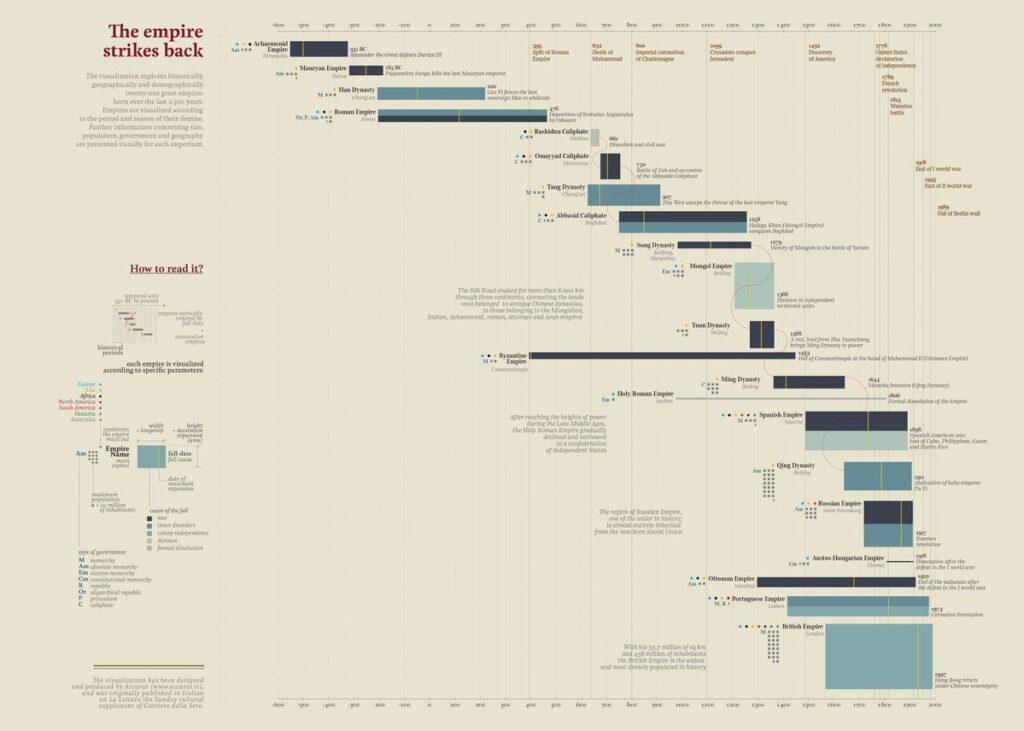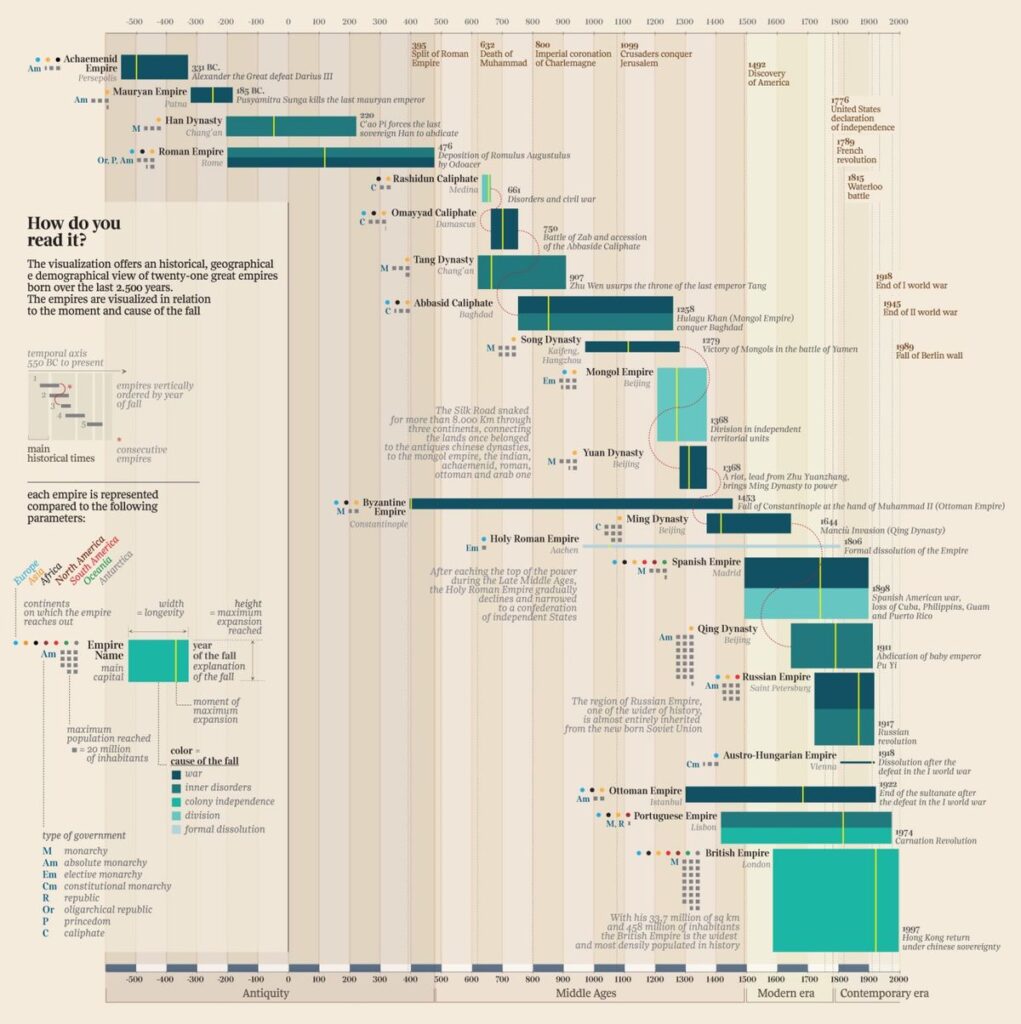
Charts that display the start and end times of each step over time and allow us to see their durations on a time axis are called Gantt charts. The inventor of the Gantt chart is the American engineer and management consultant Henry Laurence Gantt, who developed this chart in the early 1910s. Today, it is considered one of the fundamental tools in project management. Within a single Gantt chart, planned date ranges, completion rates of tasks, task categories, and the difference between planned and actual execution can be visualized.
VISUAL PERFORMANCE CHART
VISUAL CREATION PLATFORMS

SAMPLE IMAGES
Do you have any ideas or examples related to this graphic that you would like to see published here?
Share Here

