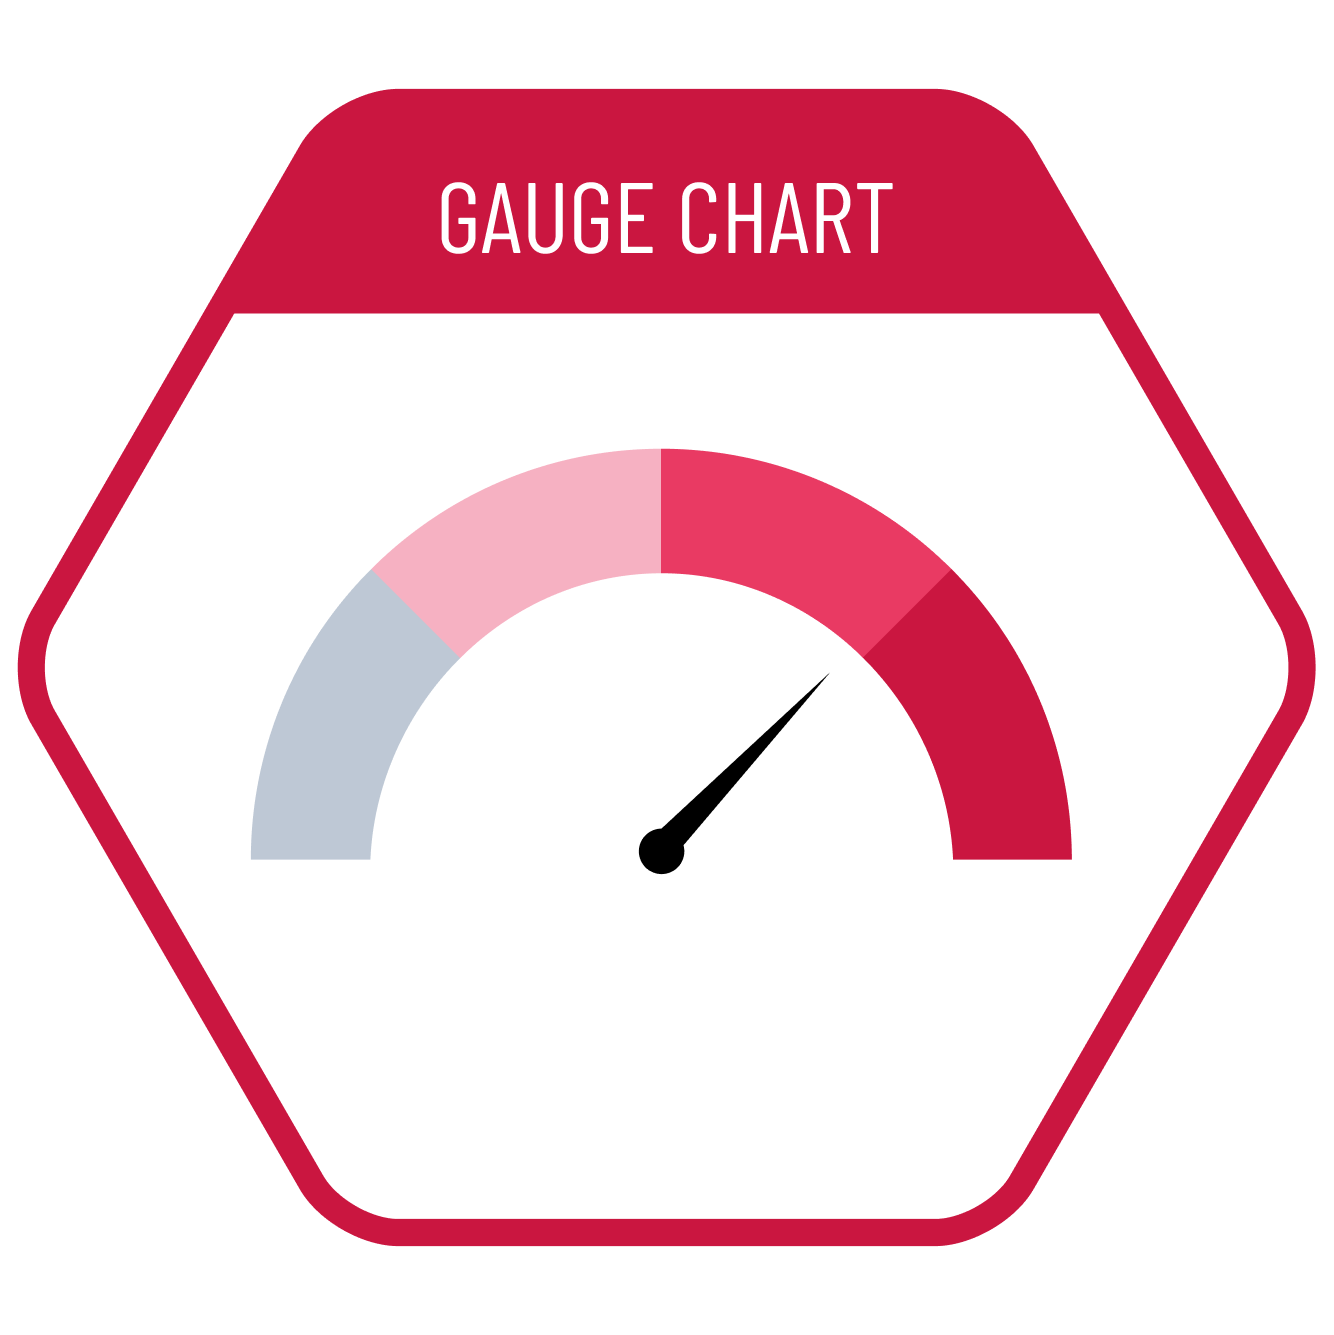
A gauge chart is an effective visualization solution for displaying a single proportion within a whole. It is widely recognized since it is used in the front panels of cars to display data such as RPM, speed, and fuel levels. By segmenting and color-coding the background, we can indicate levels and the positivity or negativity of the situation. Gauge charts come in semi-circle or two-thirds circle versions.
VISUAL PERFORMANCE CHART
VISUAL CREATION PLATFORMS

Do you have any ideas or examples related to this graphic that you would like to see published here?
Share Here