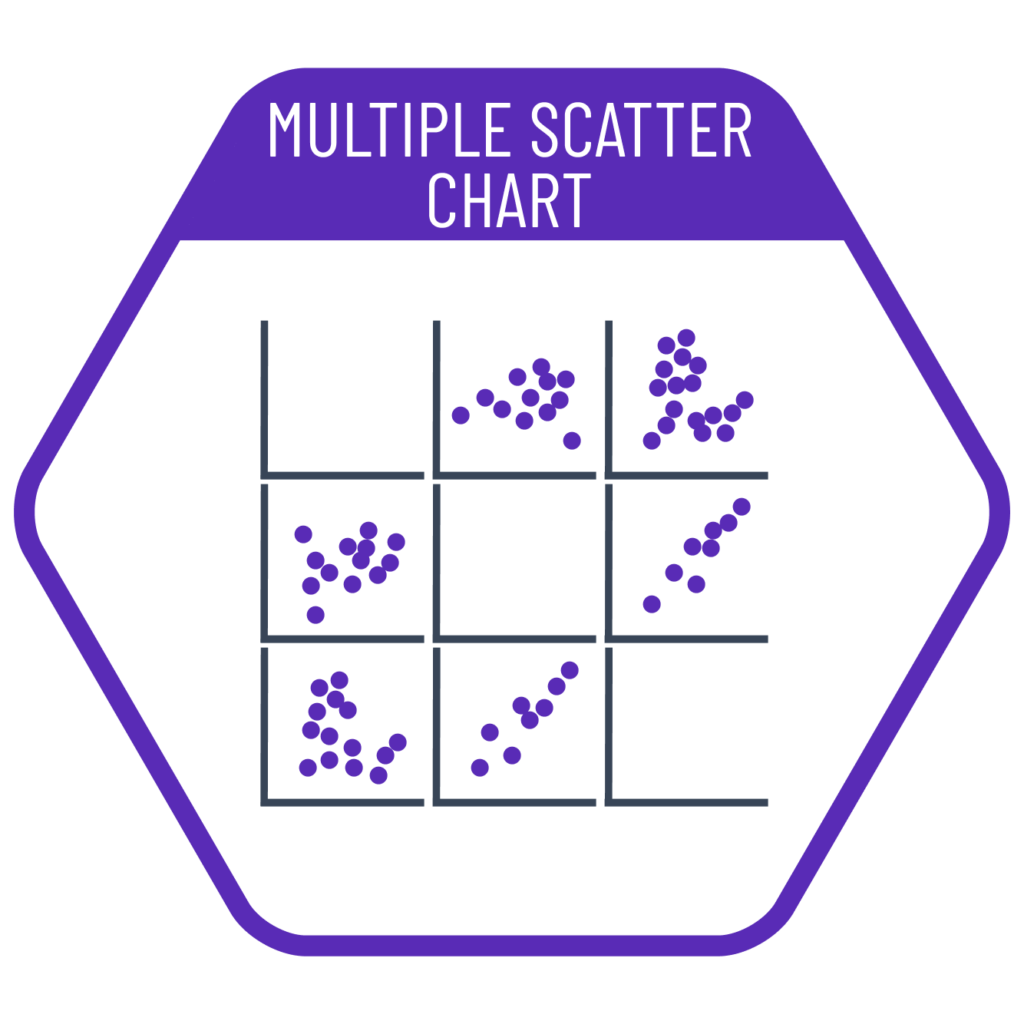
We can use a multiple scatter plot to explore how more than two parameters influence each other. For n parameters, we place charts into an nxn grid to visualize how each pair of parameters affects one another bidirectionally. This allows us to assess which parameters are related, as well as the direction and strength of those relationships.
VISUAL PERFORMANCE CHART
VISUAL CREATION PLATFORMS

SAMPLE IMAGES
Do you have any ideas or examples related to this graphic that you would like to see published here?
Share Here