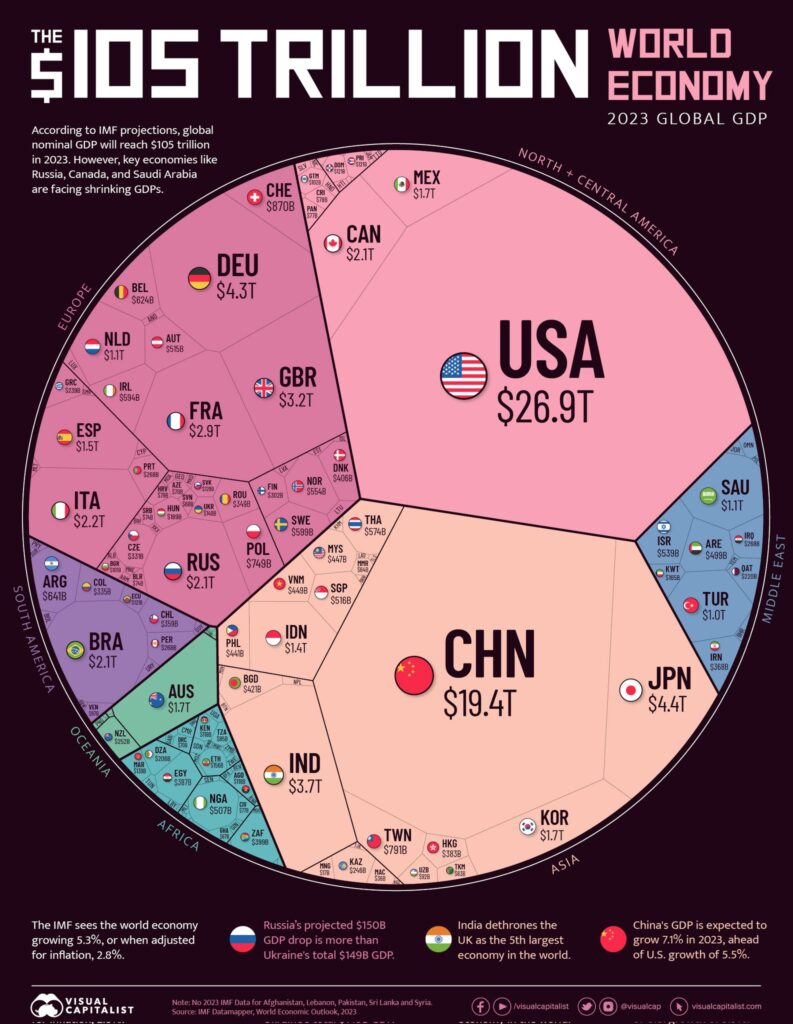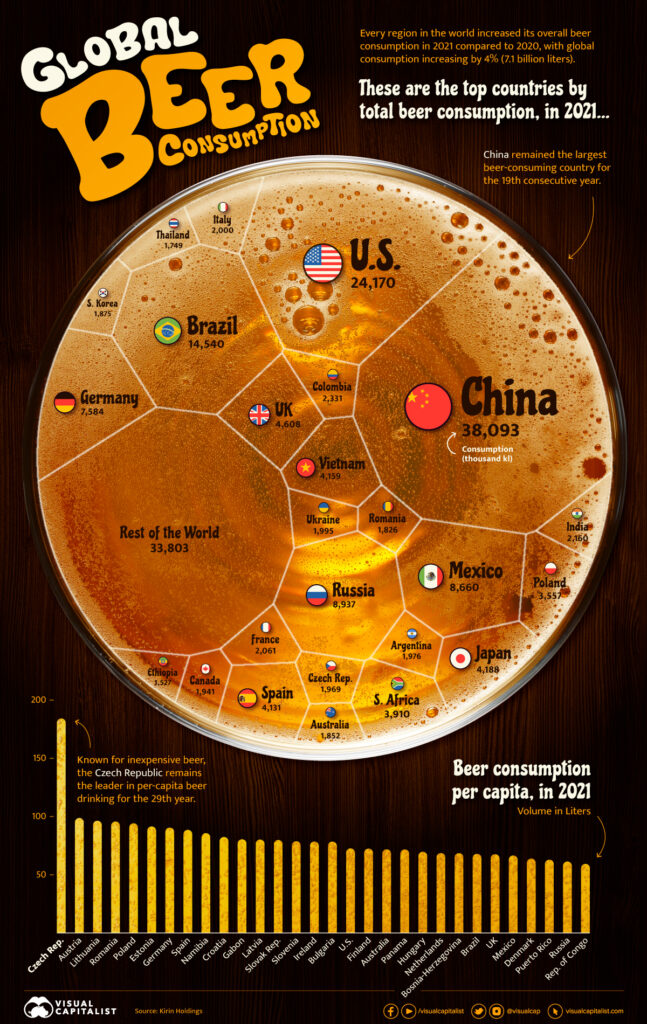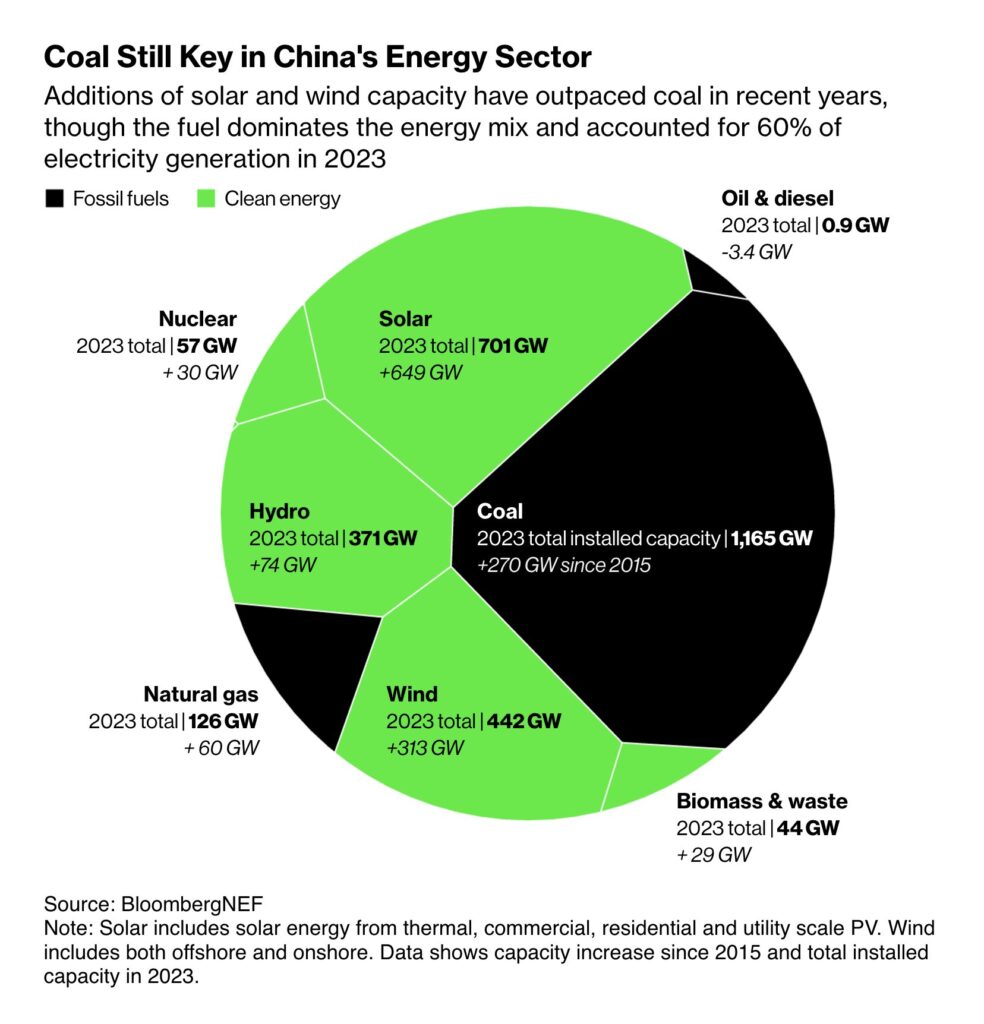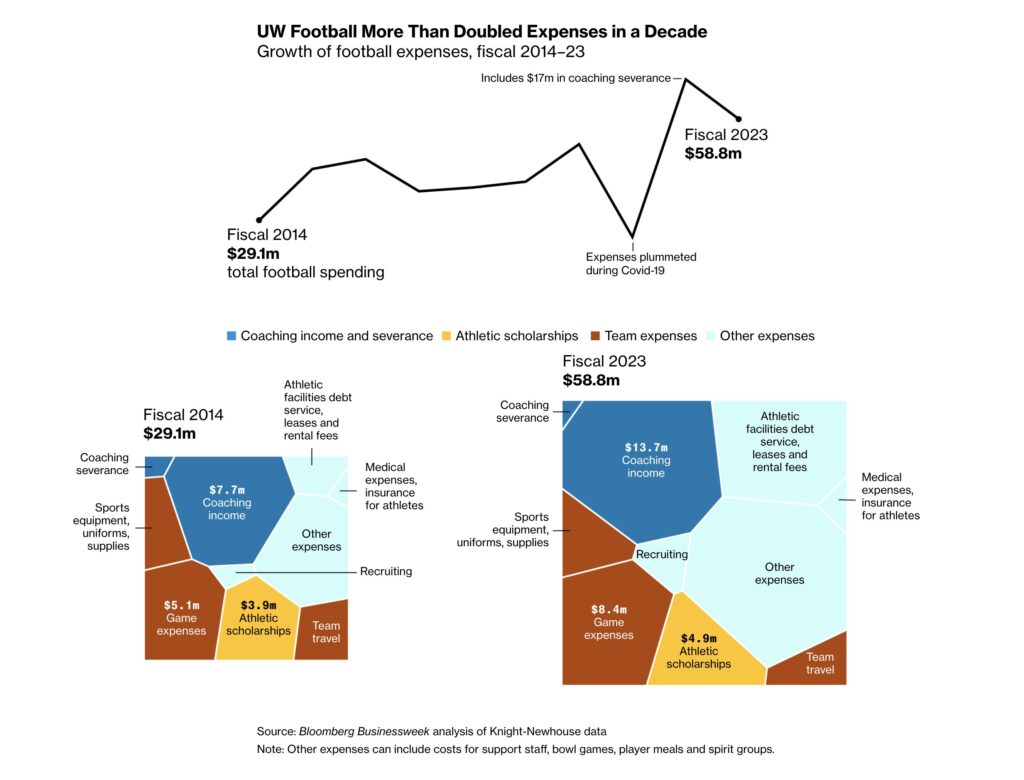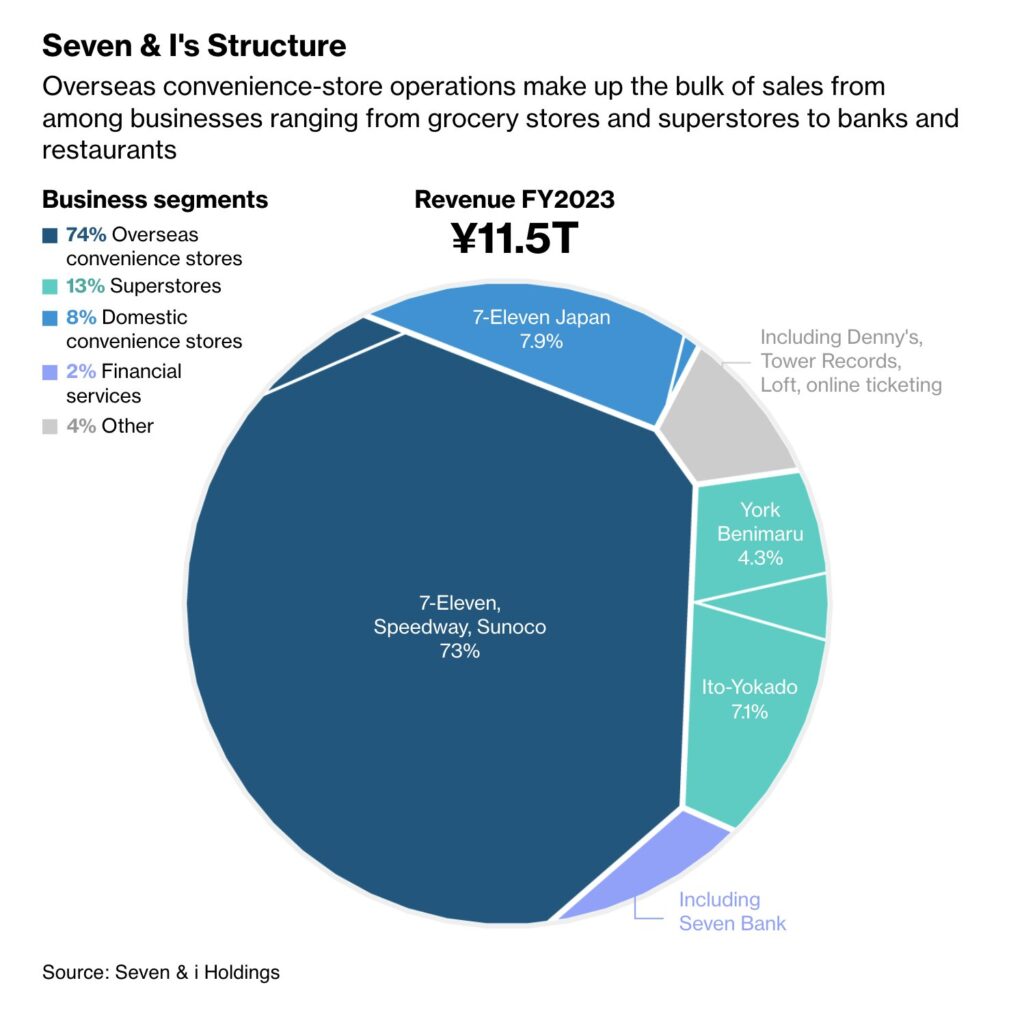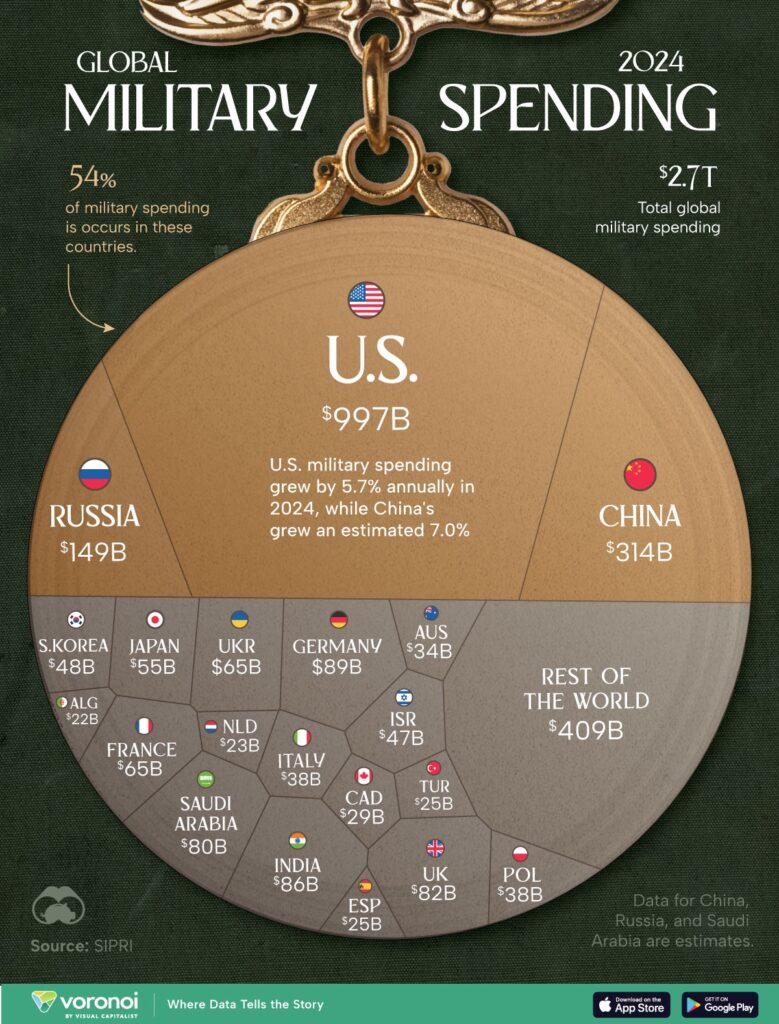
Voronoi, another chart type for comparing the parts of a whole, is named after Russian mathematician Georgy Voronoi, who pioneered this partitioning method. Voronoi diagrams use a mathematical approach to divide a space into polygonal cells based on proximity to predefined points. This partitioning method allows us to represent and compare proportions of total values. Since placing text inside polygons is easier than inside pie slices, Voronoi diagrams can be considered an alternative to pie charts.
VISUAL PERFORMANCE CHART
VISUAL CREATION PLATFORMS

SAMPLE IMAGES
Do you have any ideas or examples related to this graphic that you would like to see published here?
Share Here
