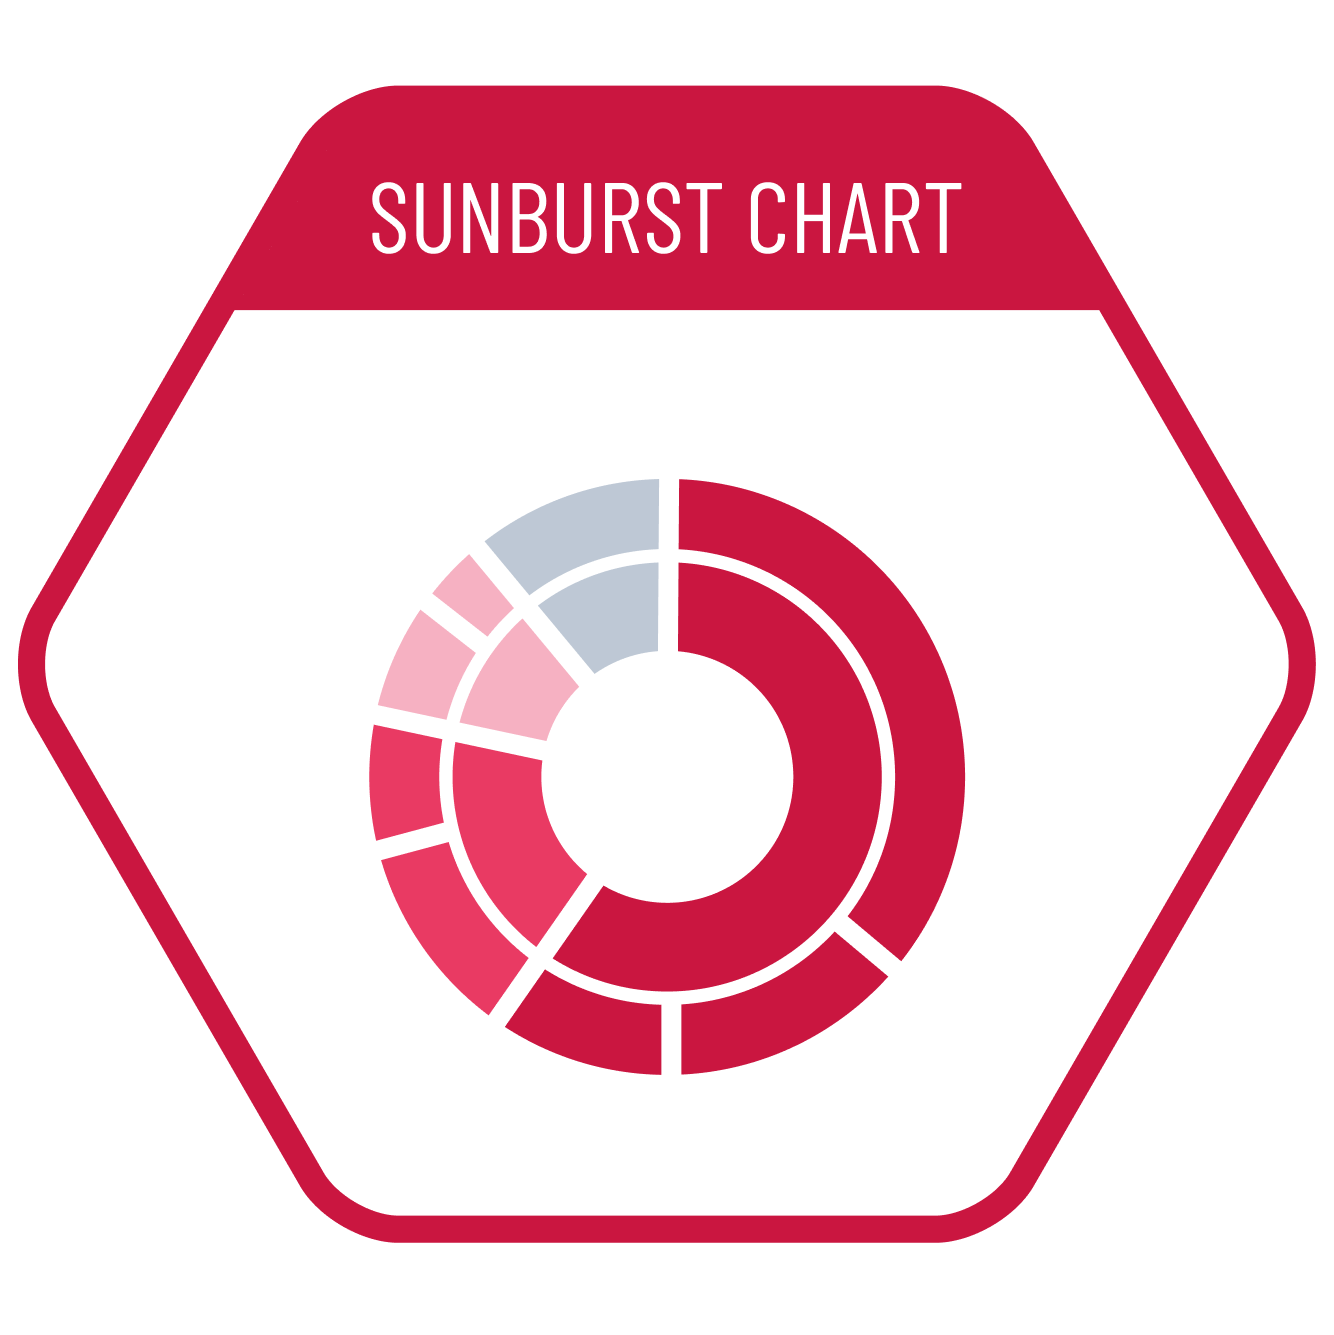
The sunburst chart is a variant of the donut chart. With this chart, we can visualize both the main segments in the donut chart and their subcategories. While exact value comparison is not easy, it provides an approximate sense of proportions, making it suitable for comparisons where value differences are clearly distinguishable.
VISUAL PERFORMANCE CHART
| Information Density |
Visual Readability |
Ease of Creation |
Familiarity | Attractiveness |
| ★★★☆☆ | ★★★☆☆ | ★★★☆☆ | ★★★☆☆ | ★★★☆☆ |
VISUAL CREATION PLATFORMS

Do you have any ideas or examples related to this graphic that you would like to see published here?
Share Here
