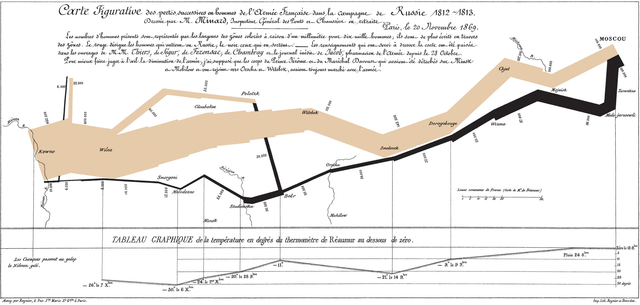
Maps that visualize movements between locations along with their directions are called flow maps. To prevent arrows from overlapping and obscuring each other, curved lines are often preferred over straight lines. The thickness of the lines represents the magnitude of the flow, while the color of the lines can be used to categorize different types of flows. Similarly, color can also help convey the direction of movement to the viewer.
VISUAL PERFORMANCE CHART
VISUAL CREATION PLATFORMS

SAMPLE IMAGES
Do you have any ideas or examples related to this graphic that you would like to see published here?
Share Here
