


At Creadata, we specialize in turning complex data into meaningful visuals, empowering your team through customized trainings, strategic consultancy, and ready-to-use digital tools.

From data storytelling to Excel mastery, we deliver tailored training experiences for professionals at every level.
Explore Trainings
We help organizations make sense of their data and design impactful visual strategies that drive decisions.
Learn More
A smart toolkit for visual thinkers — explore charts, techniques, and tips to turn data into meaning.
View the CardsContact us to explore how we can support your journey.
Contact Us


“The training Creadata provided helped us build a data culture from scratch. Their visual tools were a game changer.”
— Analytics Manager, FMCG Sector
“We used Creadata’s dashboards in our executive meetings — powerful, clean, and insightful.”
— Strategy Lead, Banking
Latest Insights
I wanted to raise this question by sharing a post on Linkedin recently: Is there a difference between a column chart and an area chart? If so, what is the reason? Which one should be used in which case? The examples I used were the monthly turnover and the monthly cash in the cash register.…
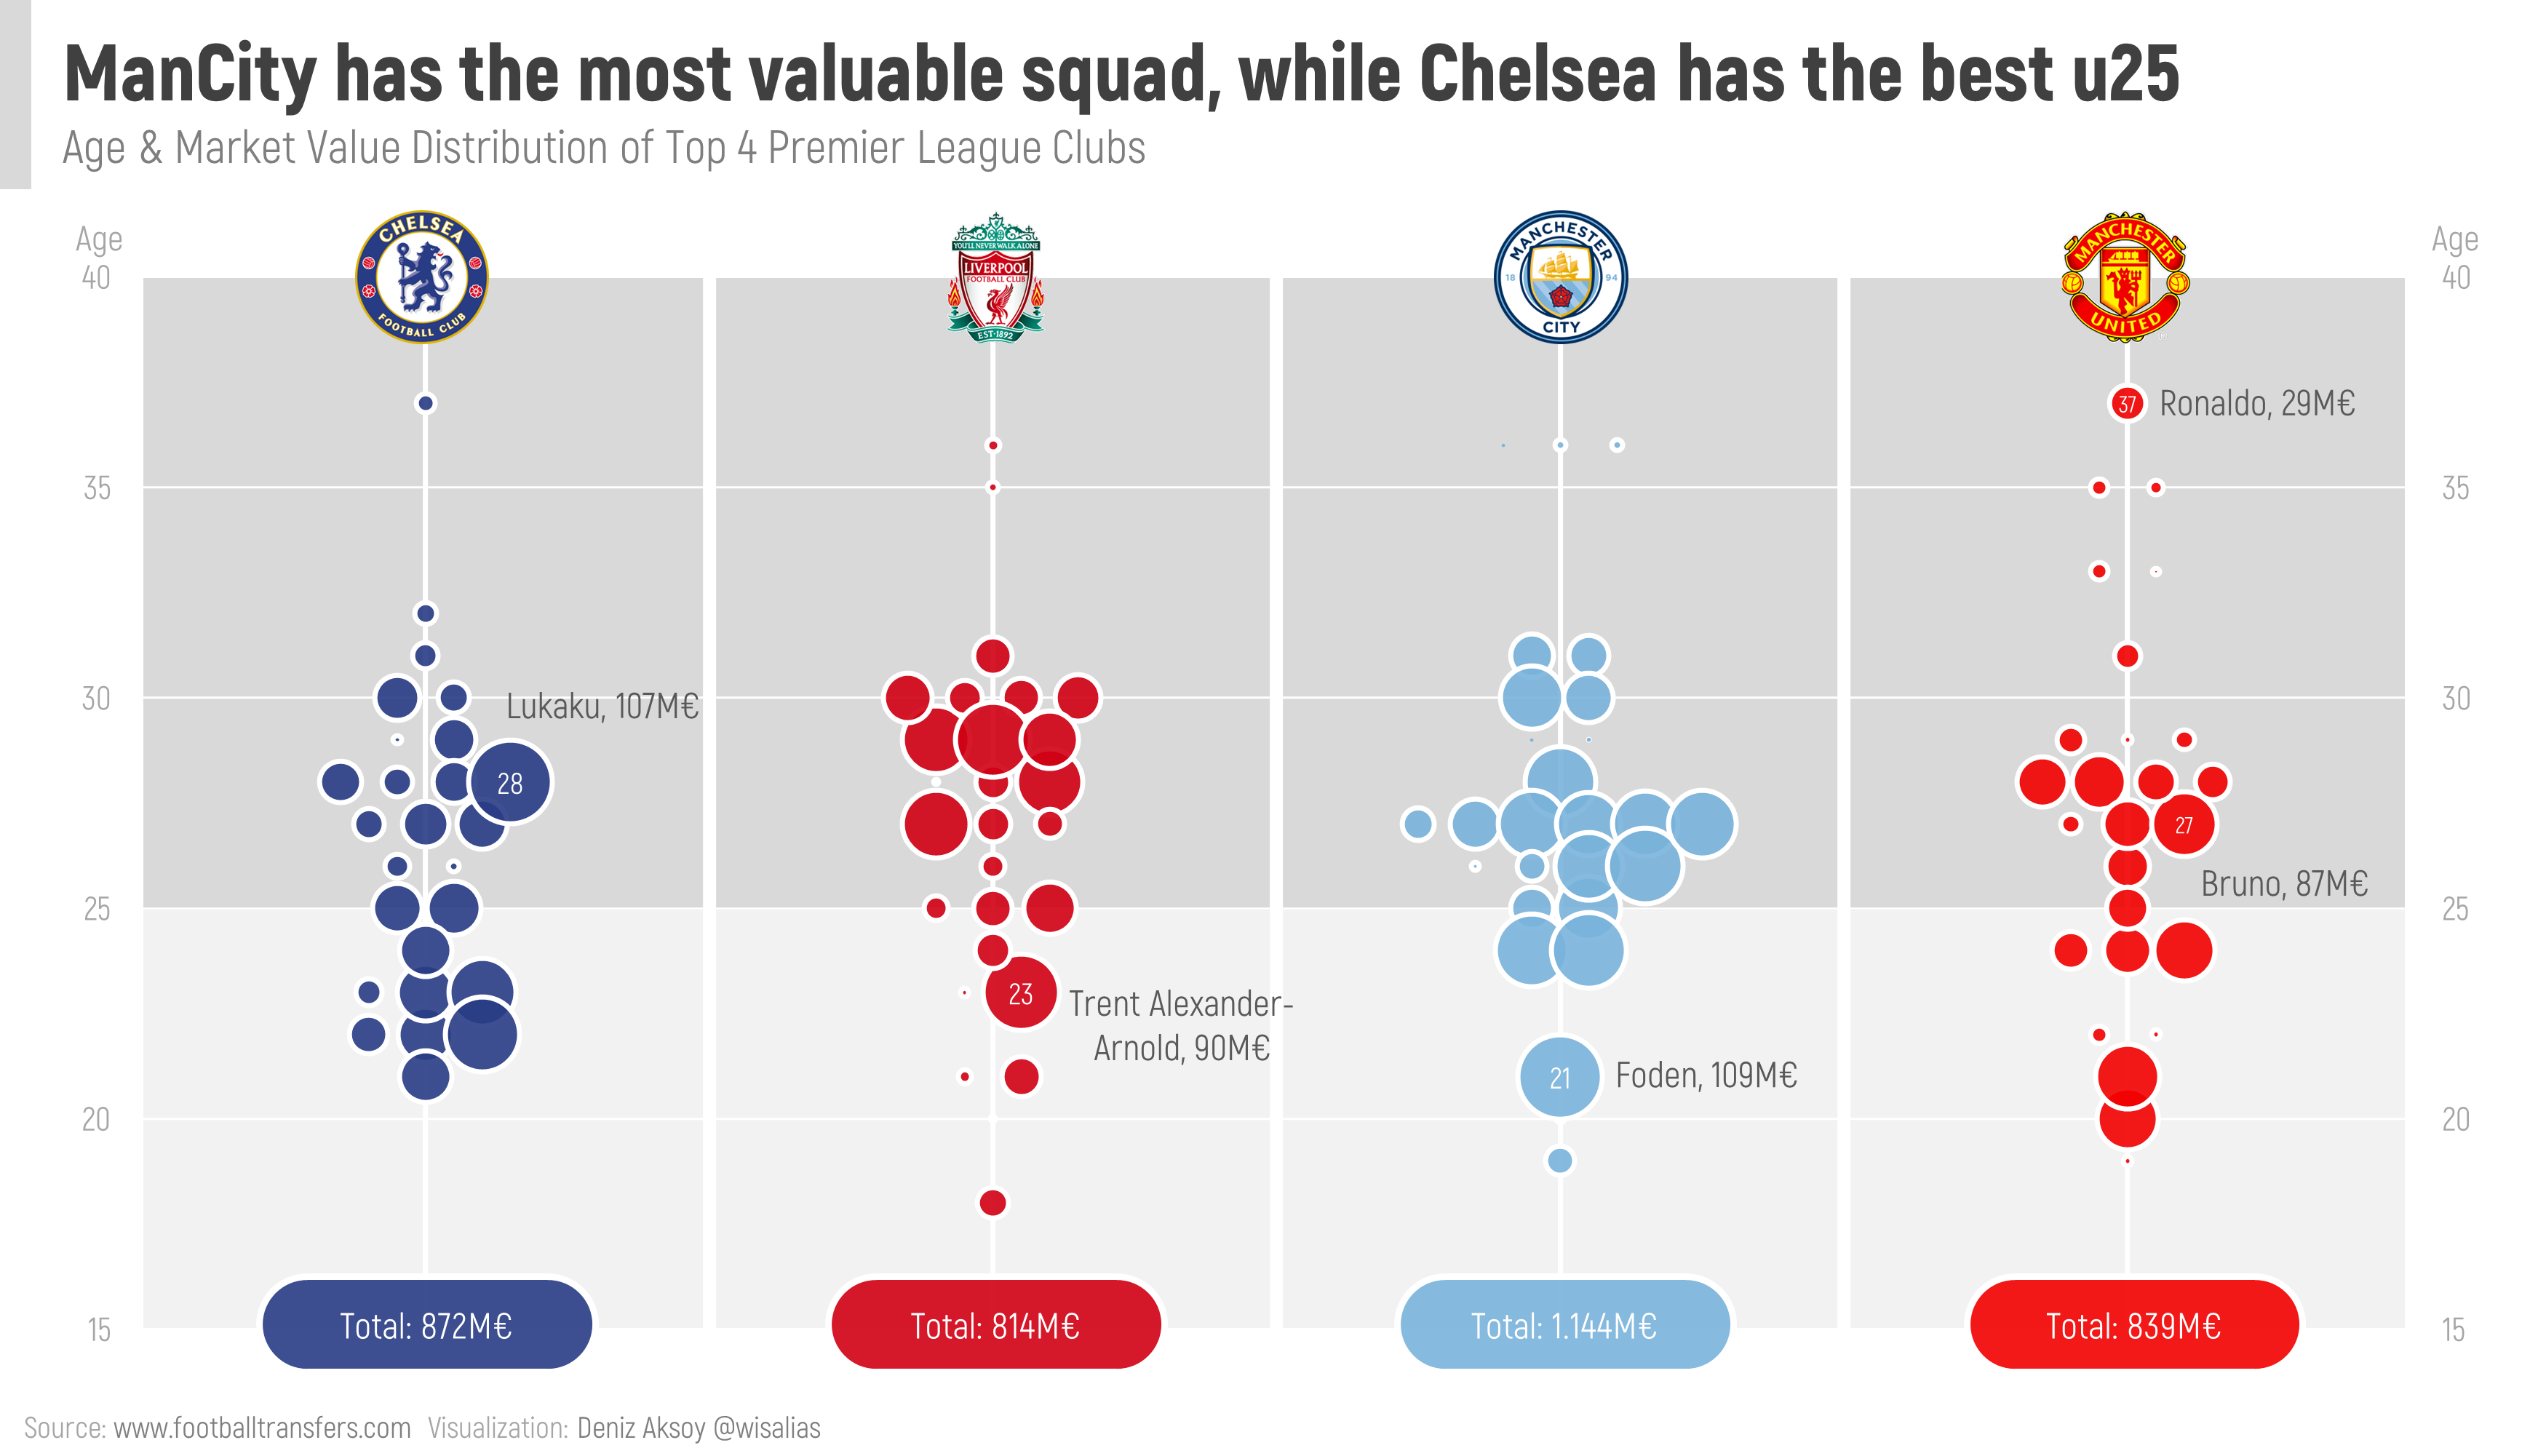
I want to create a bee swarm chart with World Cup 2022 quarter finalist teams’ data. Let’s make it step by step in Excel together. Data I found on internet was as below. I copied the top 10 rows of the whole data here. No Pos Player Date of Birth Age Caps Goals Club Country…