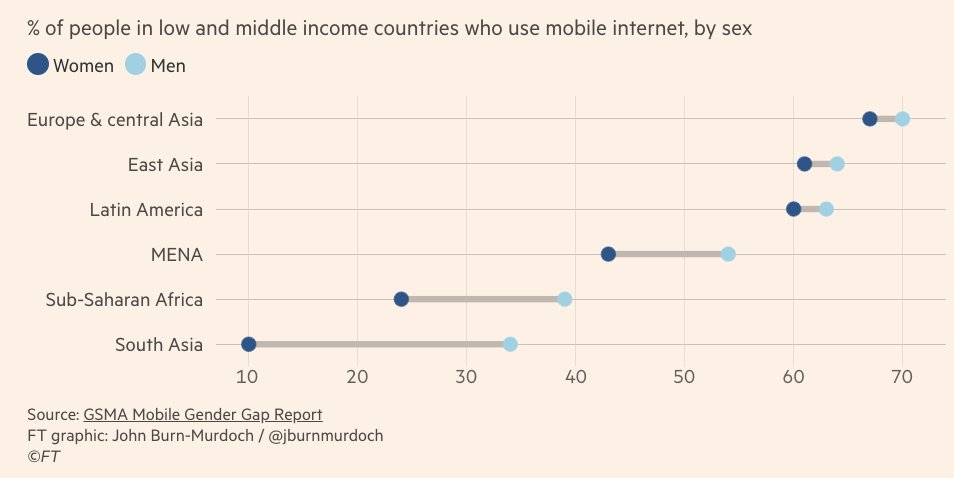
When the values in the dataset are close to each other and far from zero, using charts based on bar length may not reveal the story clearly as the bars’ similarity complicate seeing the differences. In this case, lane charts which rely on point positions rather than bar lengths come into play. Dumbbell charts are best for scenarios where the two values of our categories and the difference between them are important. If time-related data is involved, dumbbells should be used vertically, whilst for categorical data, horizontal dumbbells work as well.
VISUAL PERFORMANCE CHART
VISUAL CREATION PLATFORMS

SAMPLE IMAGES


Do you have any ideas or examples related to this graphic that you would like to see published here?
Share Here