Column charts are used to visualize and compare data across different categories. Each column represents a category, and its height indicates the value for that category. They are among the most commonly used visualization methods since they rely on one of the easiest visual comparisons for our brains – bar length. They are ideal for comparing independent categories such as sales volumes, product comparisons, and annual performances. If we have more than 20 categories, the chart may become cluttered. In those cases, we might consider alternative solutions.
VISUAL PERFORMANCE CHART
VISUAL CREATION PLATFORMS

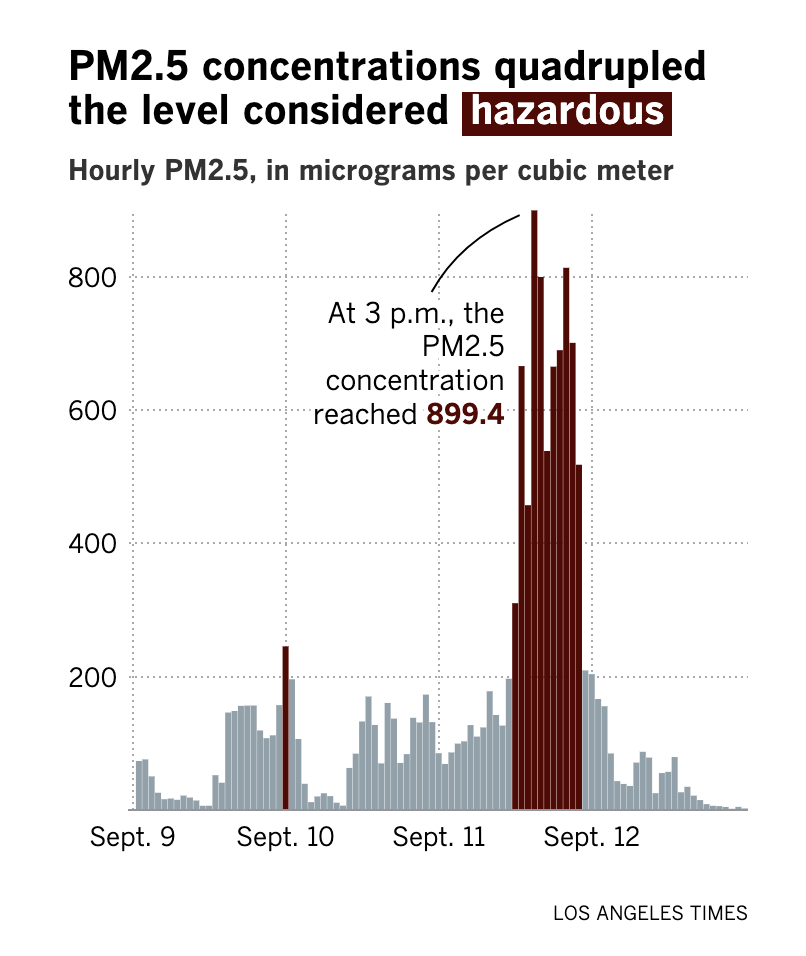
SAMPLE IMAGES


Do you have any ideas or examples related to this graphic that you would like to see published here?
Share Here