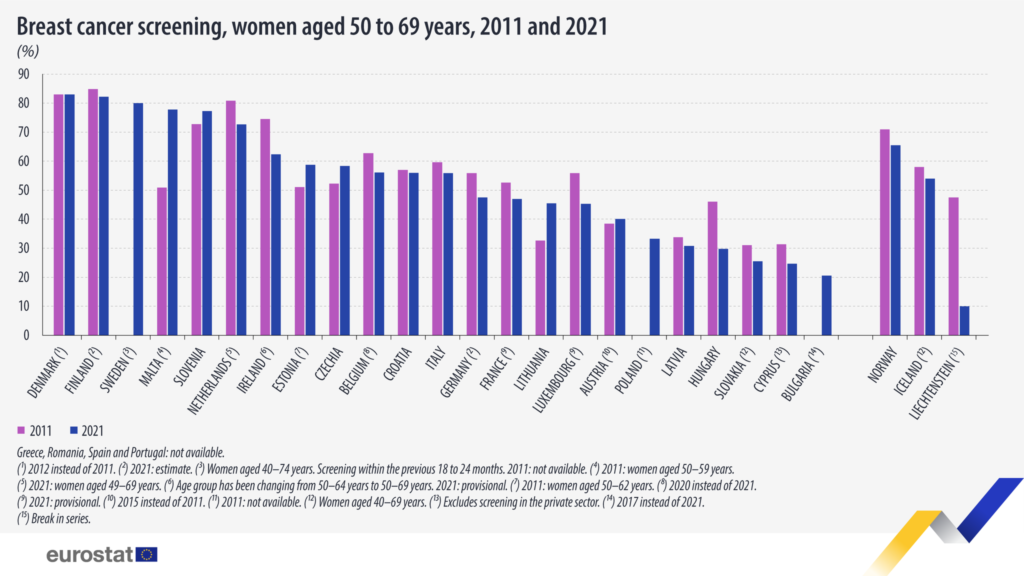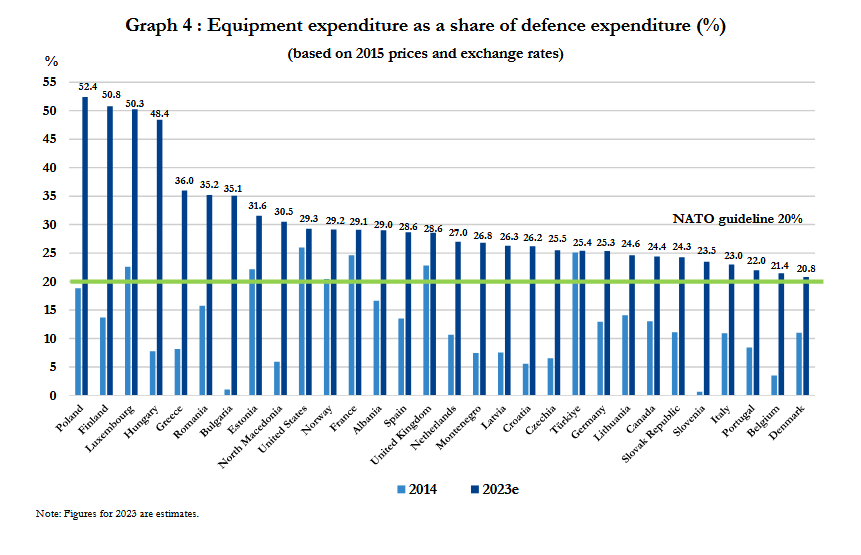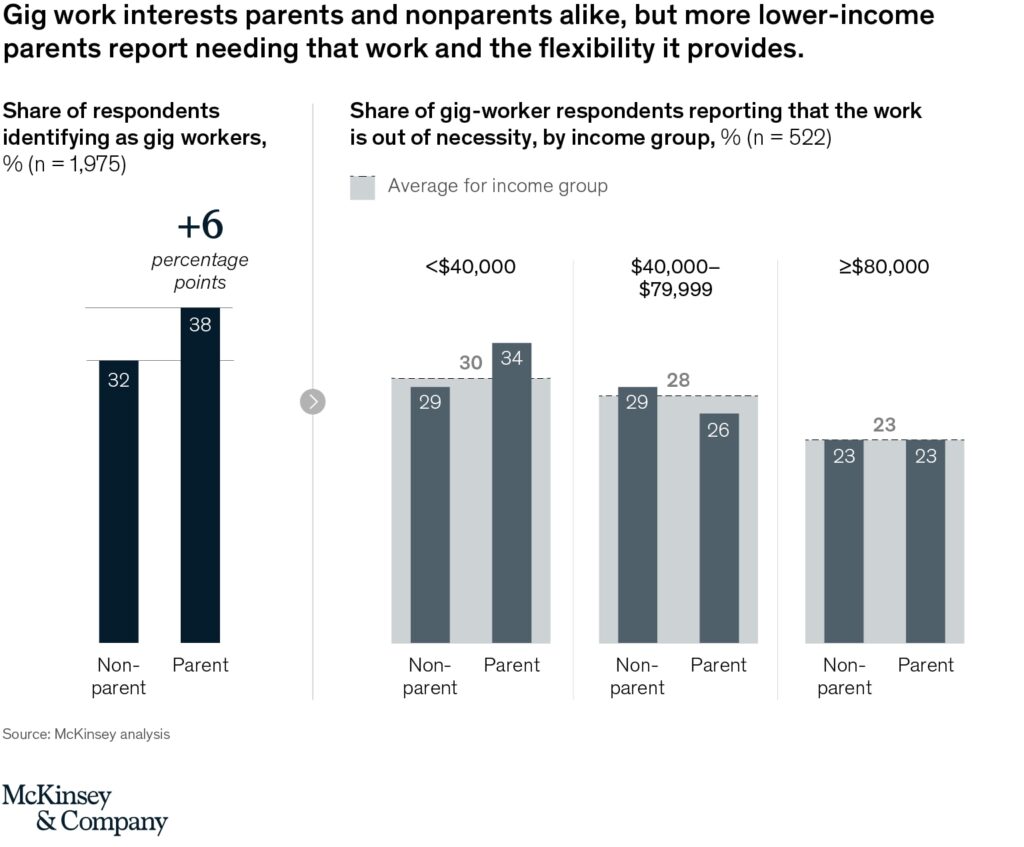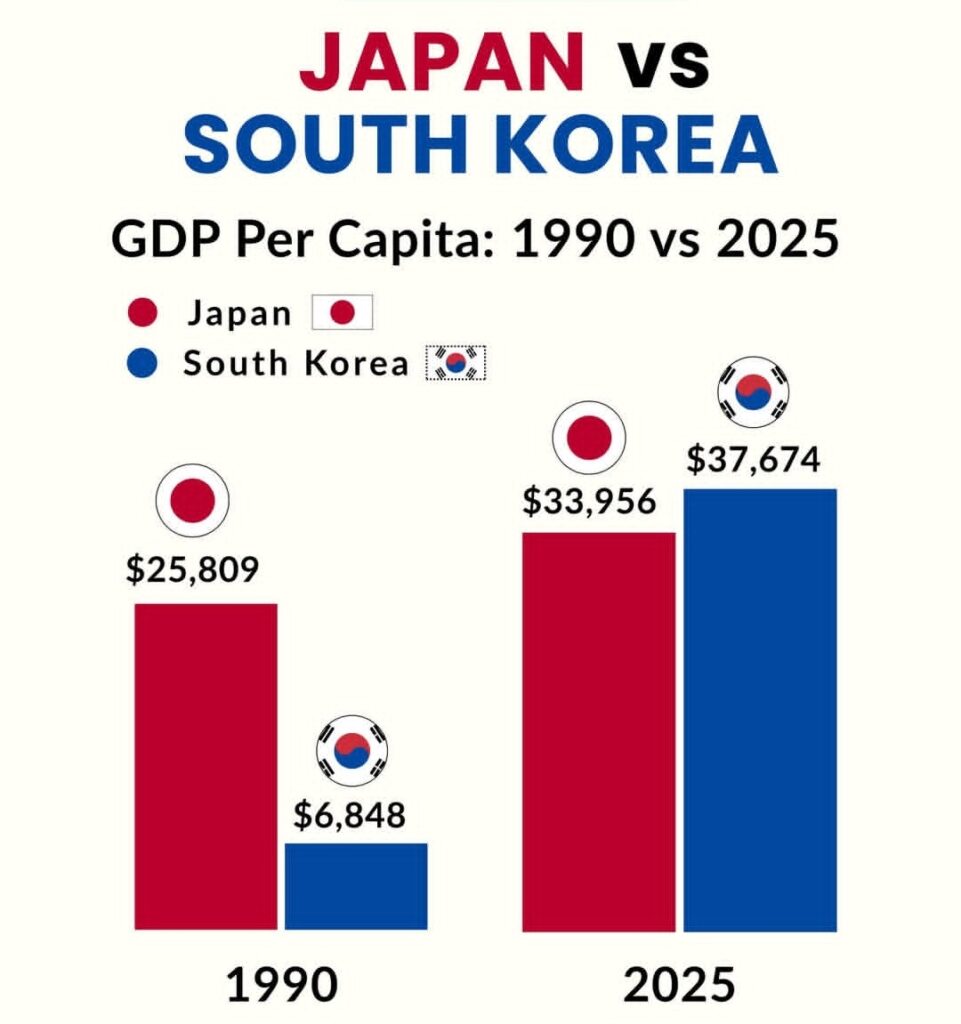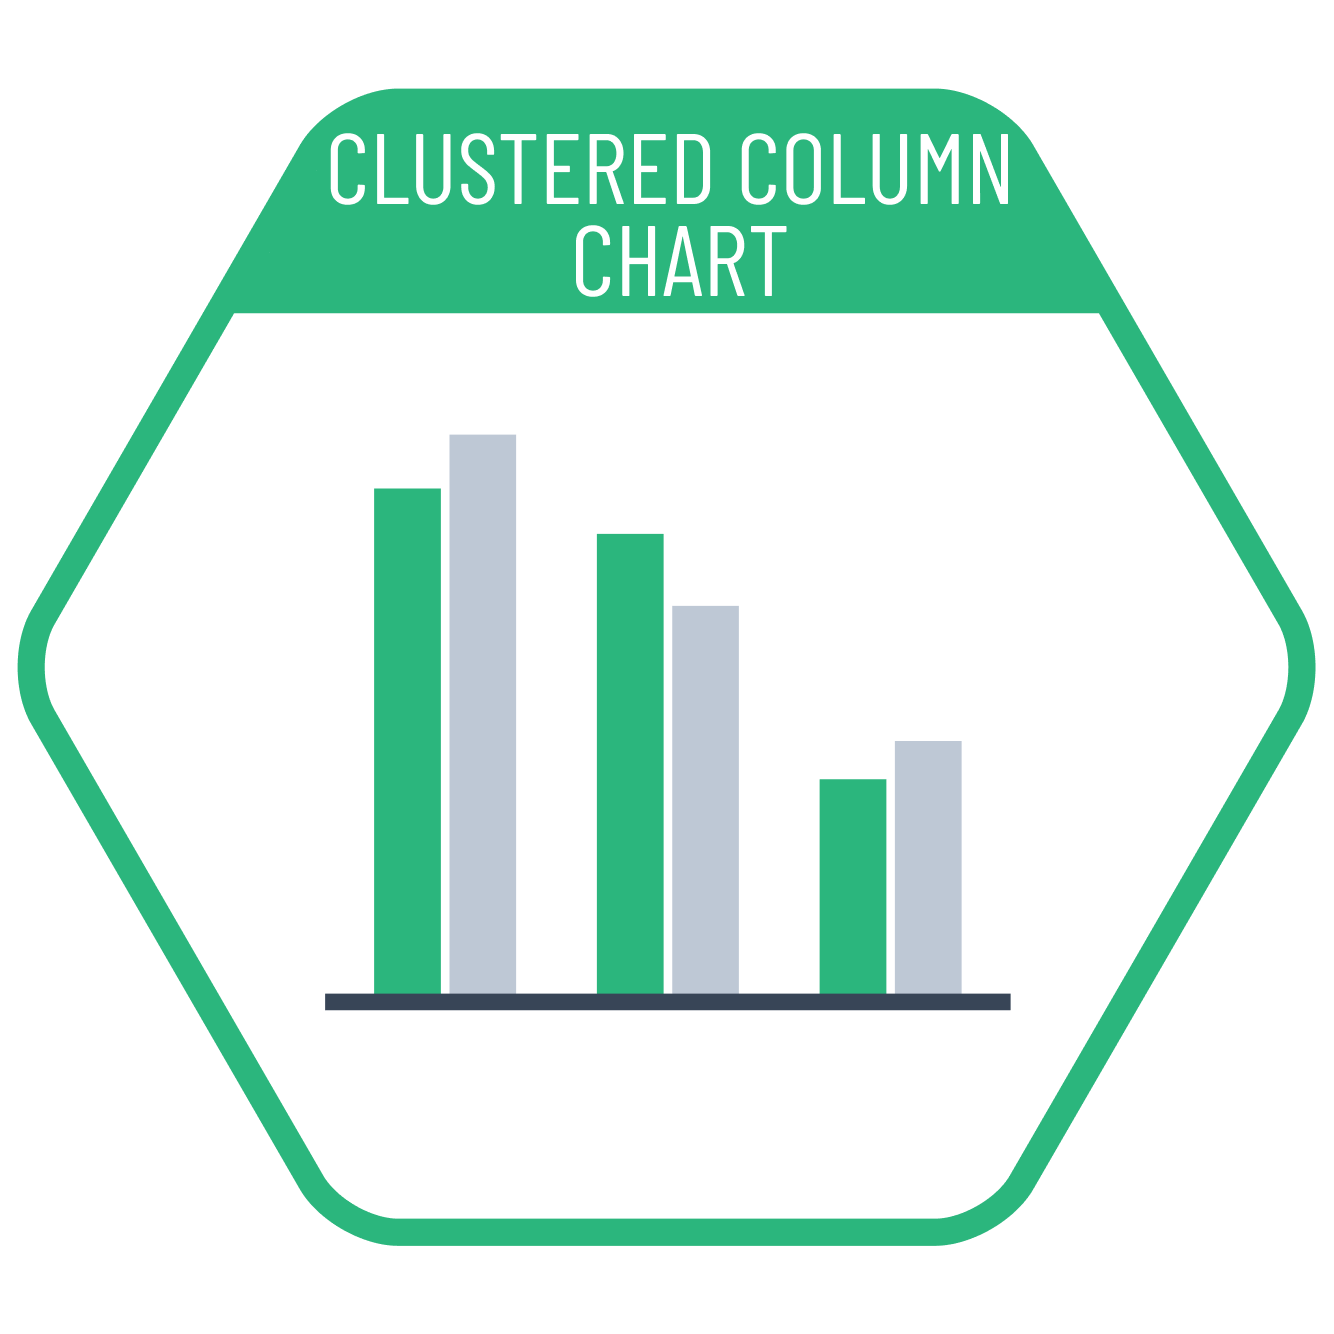
The clustered column chart is used to compare data with two categorical breakdowns. Columns can be clustered according to the category that holds more importance. For meaningful visualization, data in both categories should have equal significance, and there should be intention to compare all data columns.
VISUAL PERFORMANCE CHART
VISUAL CREATION PLATFORMS

SAMPLE IMAGES
Do you have any ideas or examples related to this graphic that you would like to see published here?
Share Here
