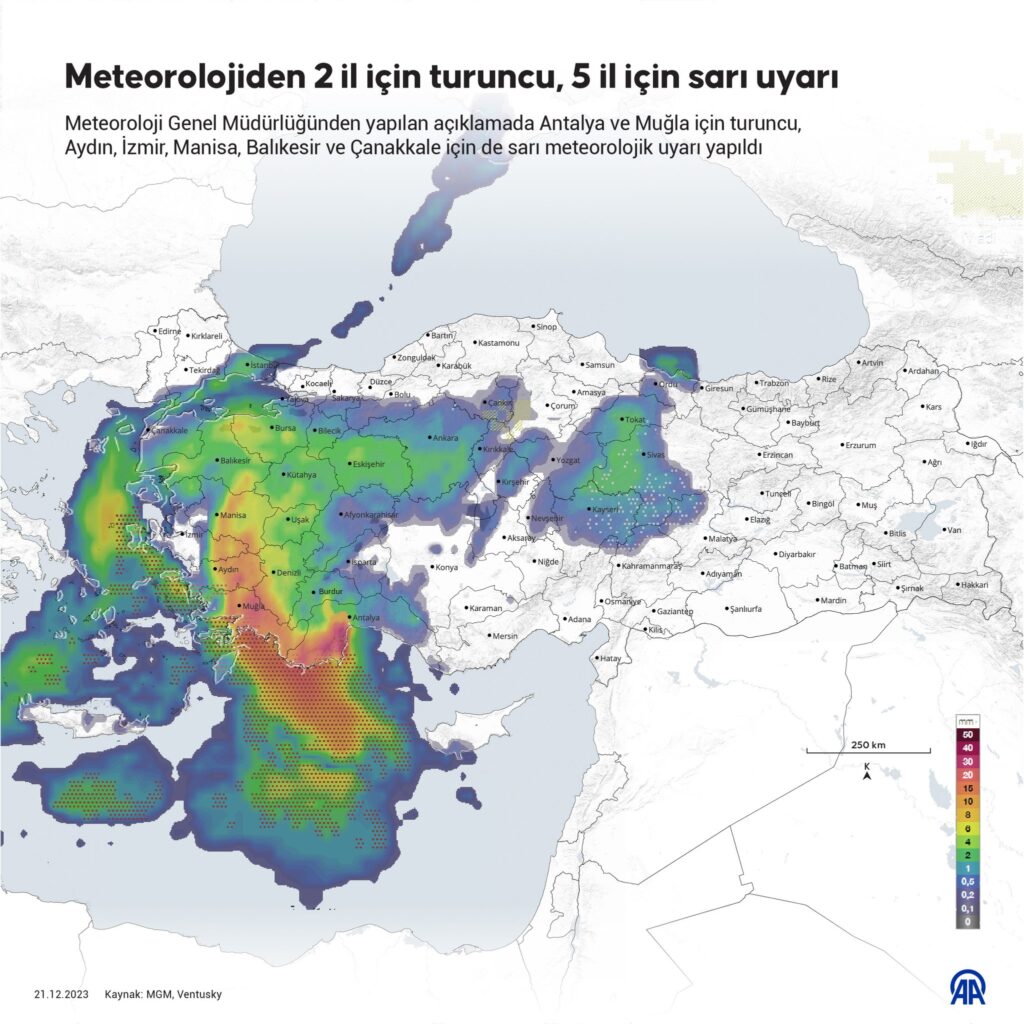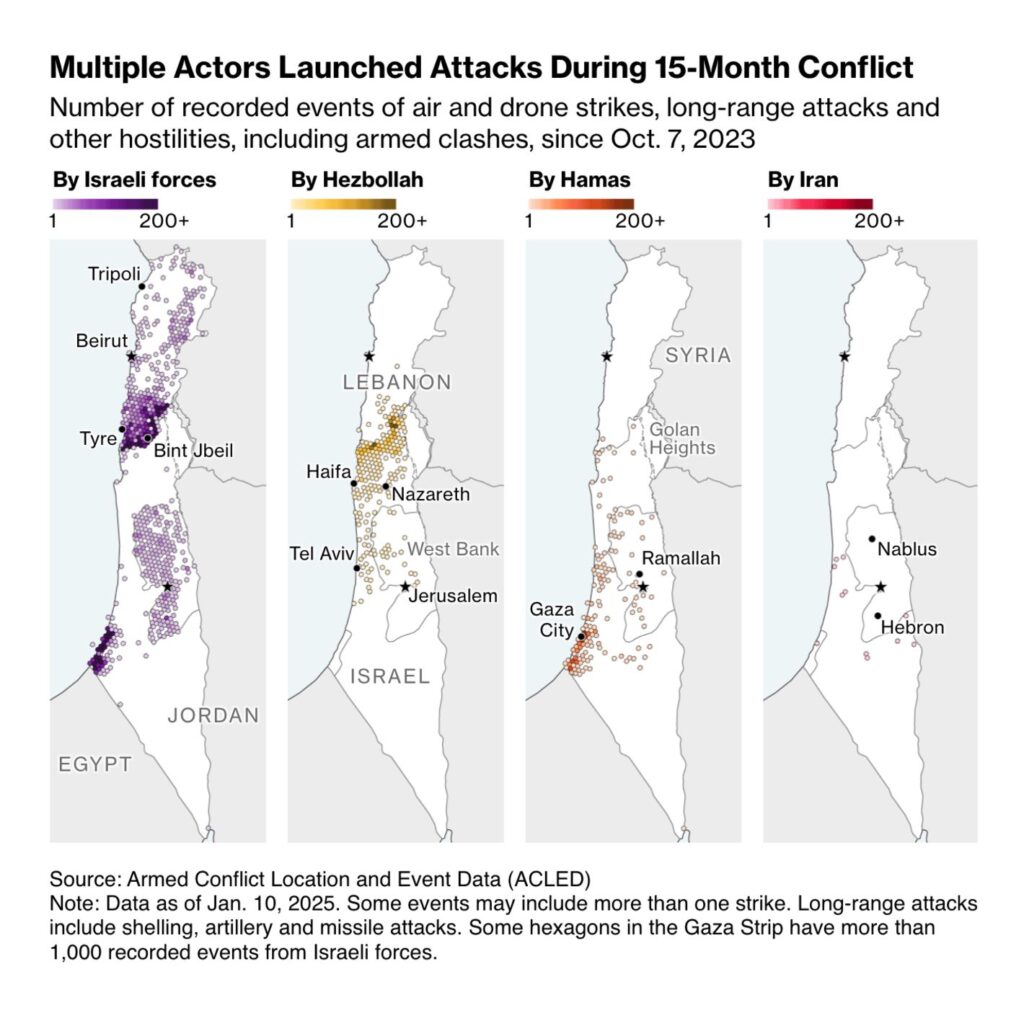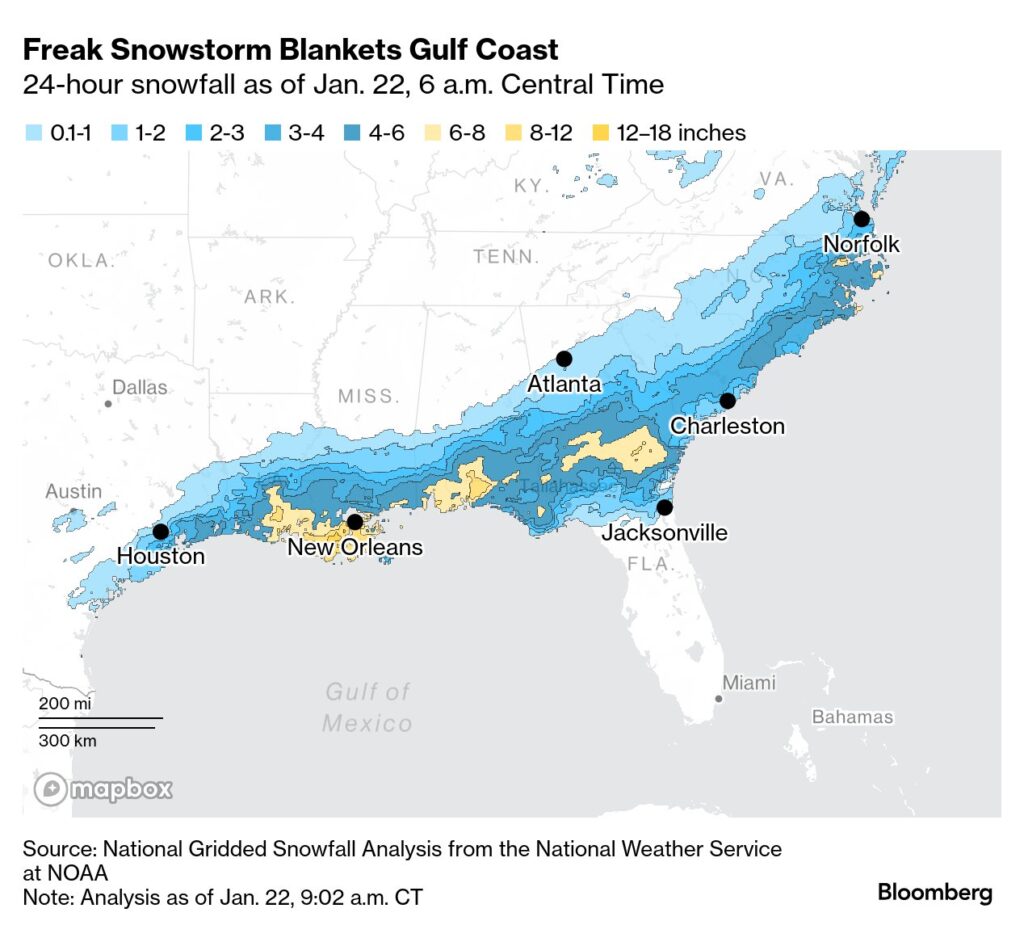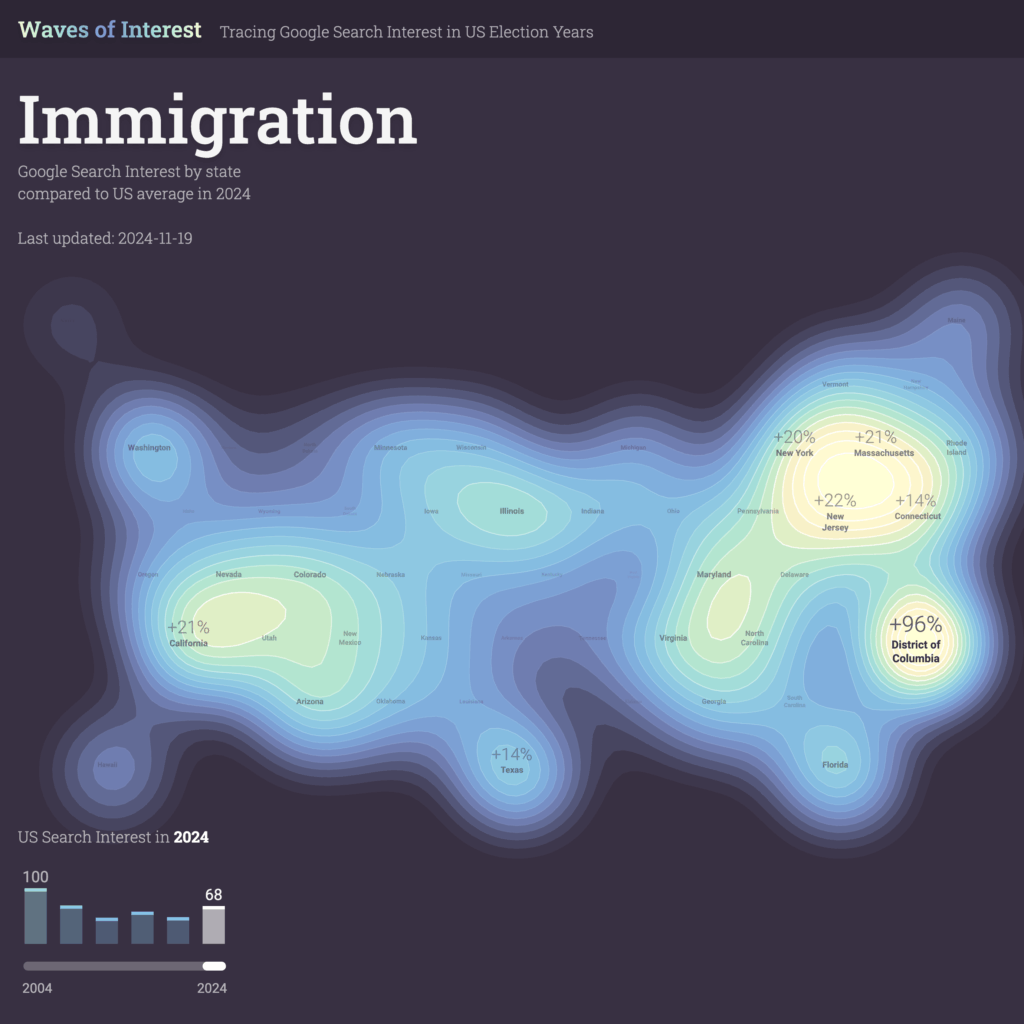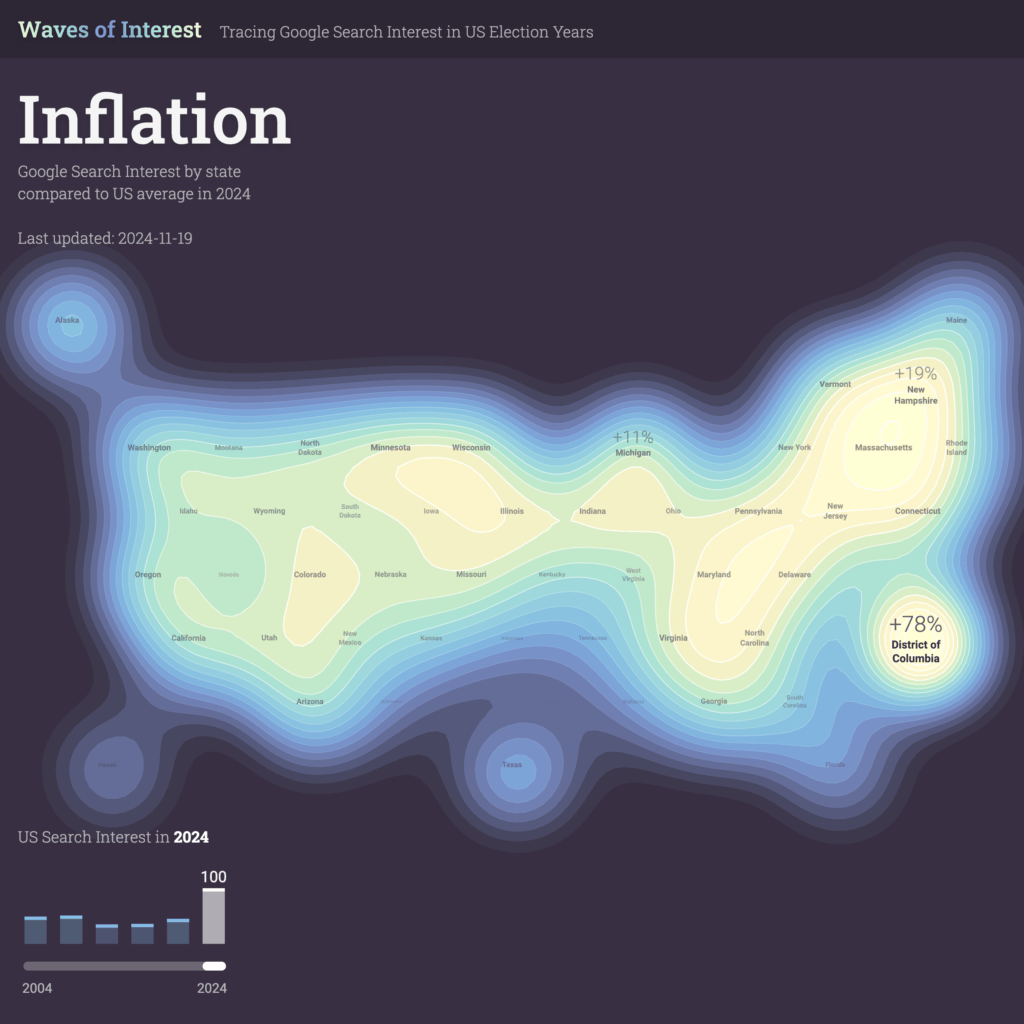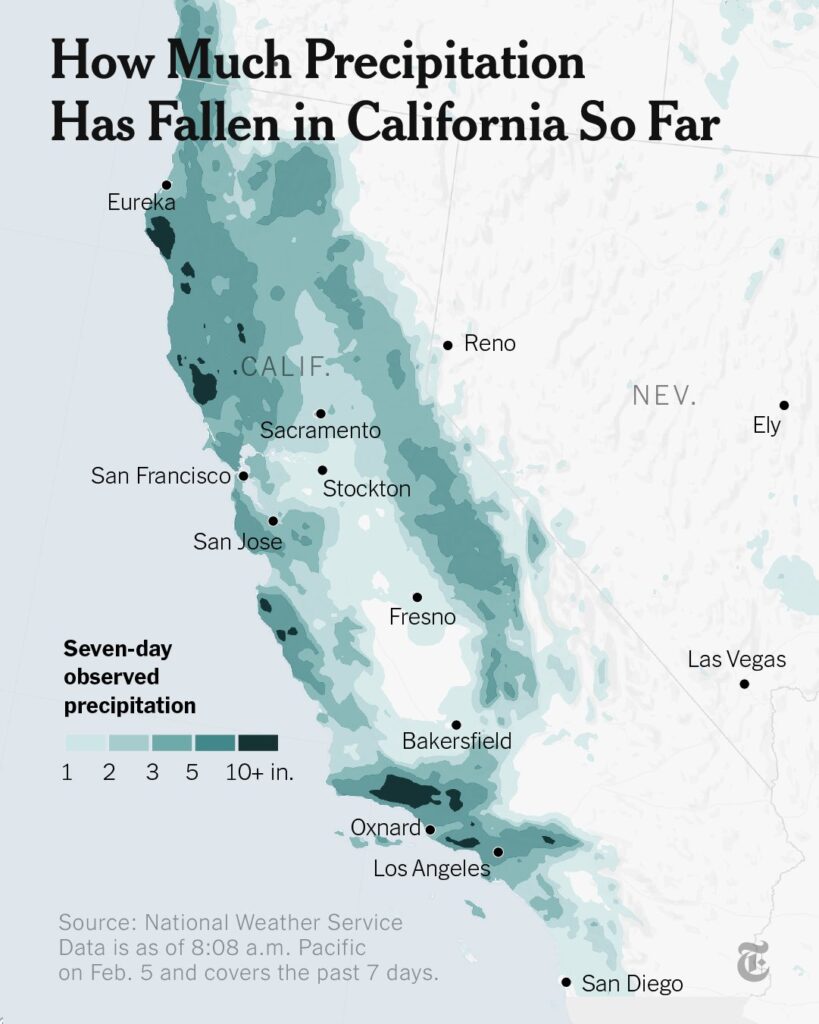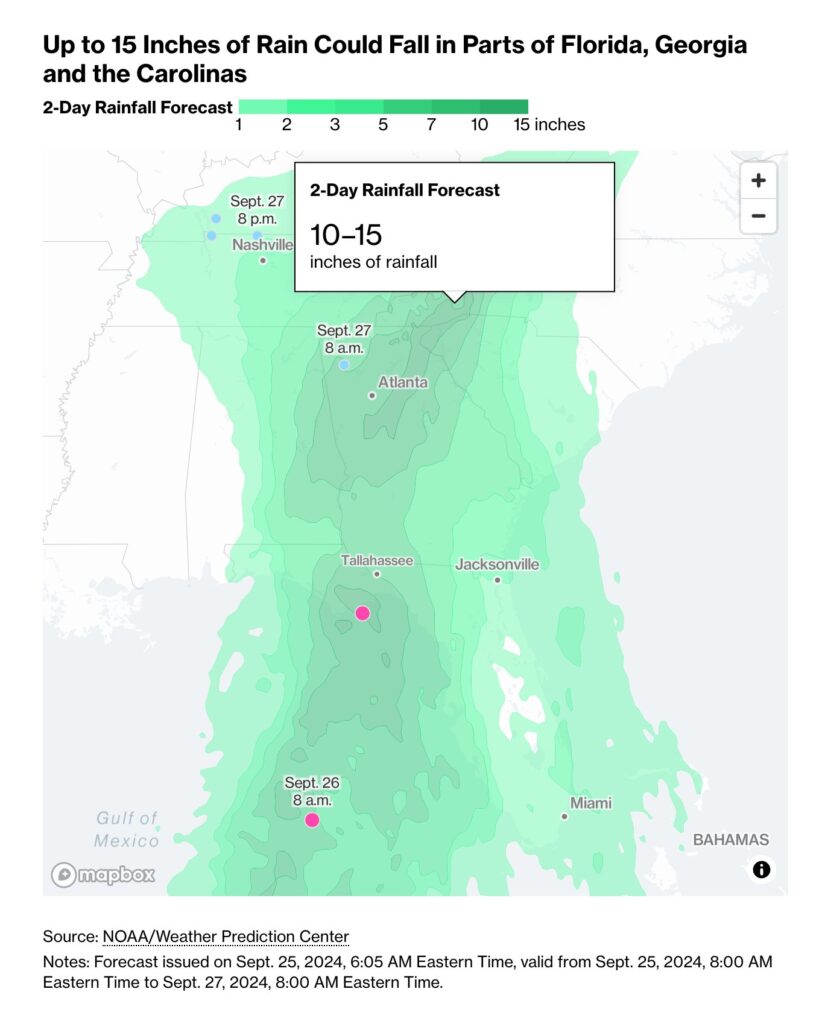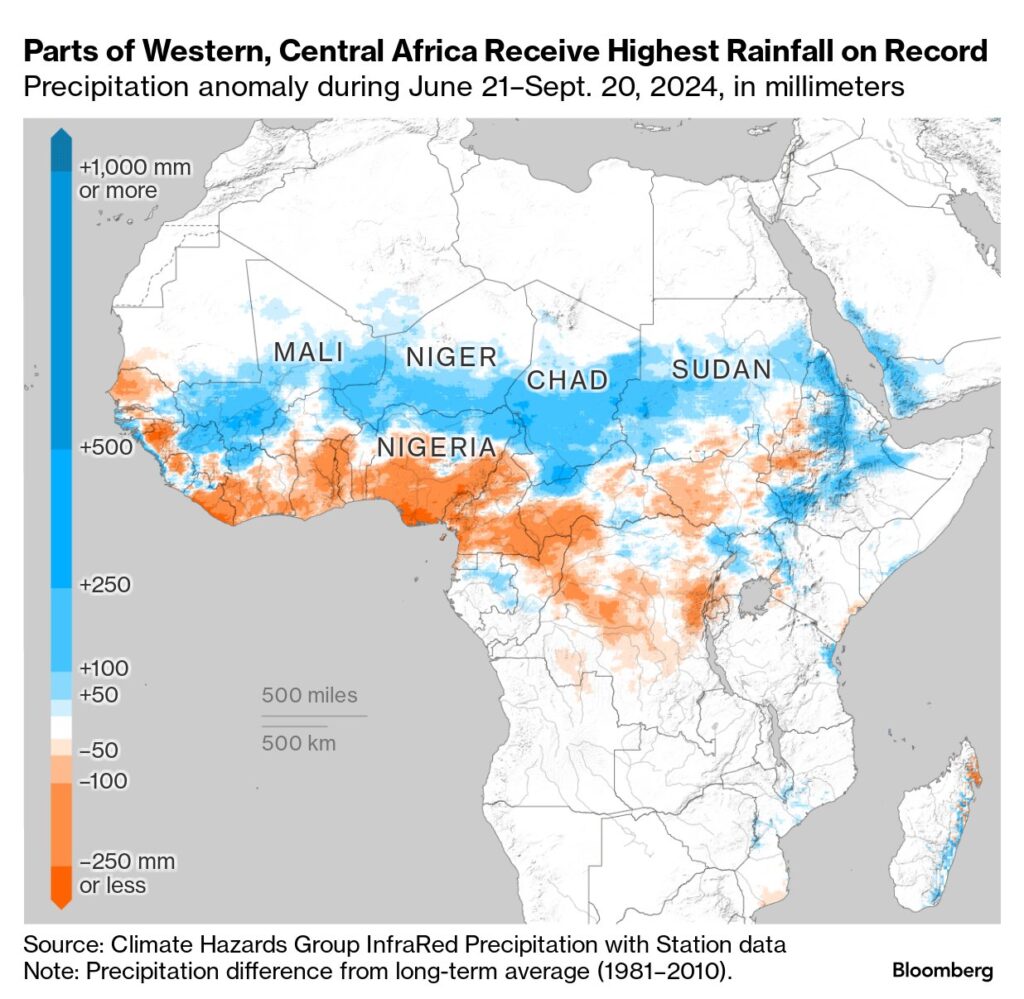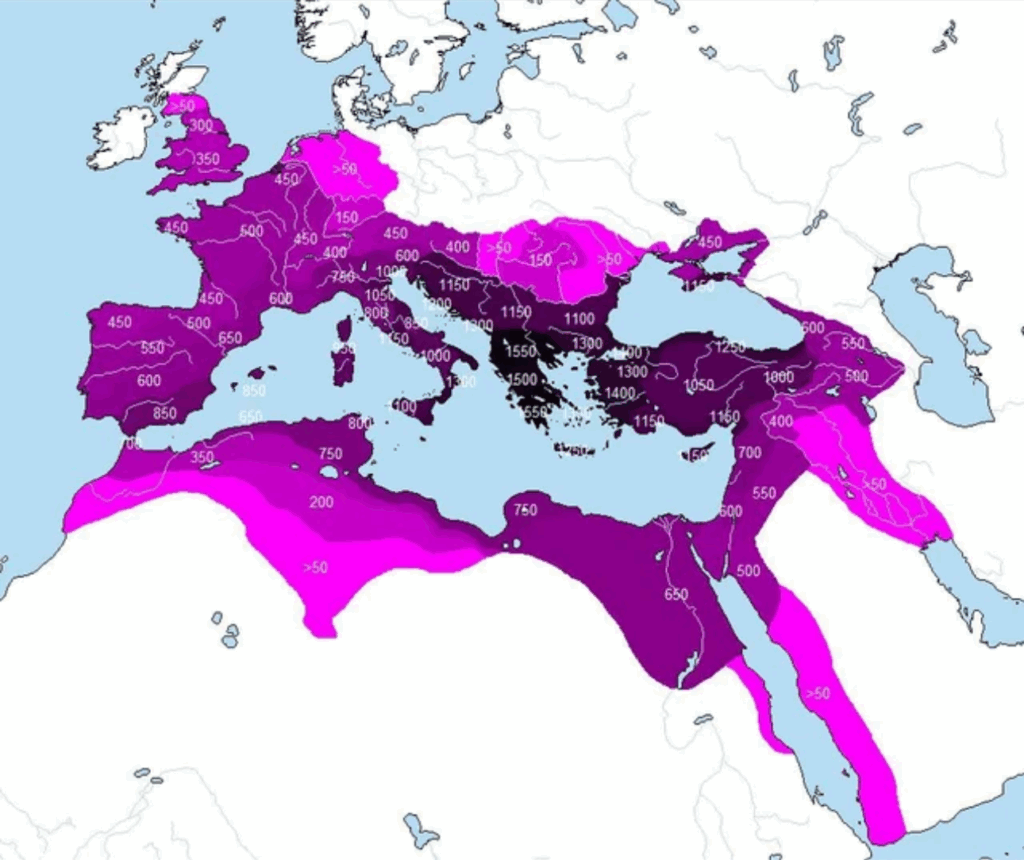
Visualizations that display the values associated with specific locations by directly coloring the exact positions—rather than aggregating them by geographic units—are called location heat maps. The most commonly used color palette for these maps is the traffic light palette (green-yellow-red). However, it’s important to remember that this palette may not be distinguishable for readers with color vision deficiency (color blindness).
VISUAL PERFORMANCE CHART
VISUAL CREATION PLATFORMS

SAMPLE IMAGES
Do you have any ideas or examples related to this graphic that you would like to see published here?
Share Here
