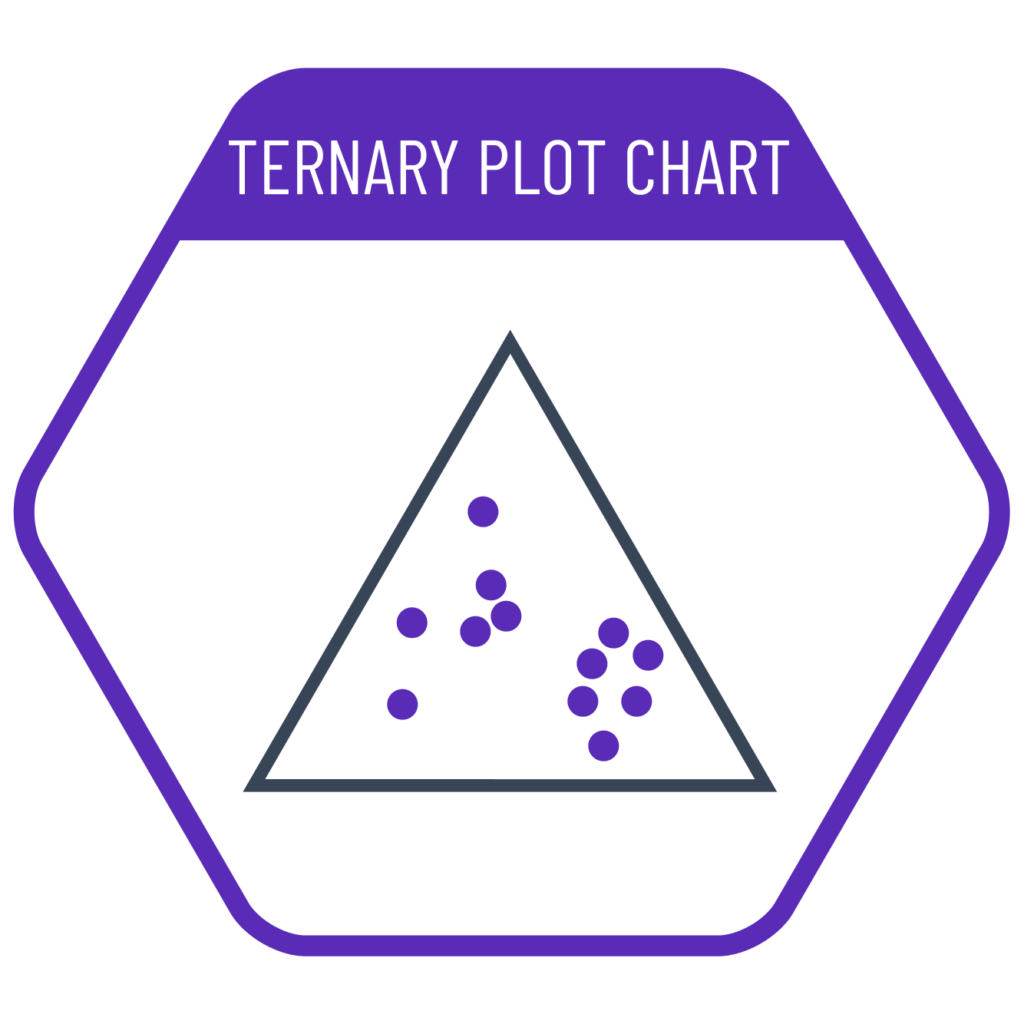
The triangle/ternary plot is used to show how data is distributed across three parameters in percentage terms. A key point to consider is that the parameters in this chart cannot be independent of one another. They must be parts of a whole. Therefore, the sum of the three values for each point on the chart must equal 100%.
VISUAL PERFORMANCE CHART
VISUAL CREATION PLATFORMS

Do you have any ideas or examples related to this graphic that you would like to see published here?
Share Here