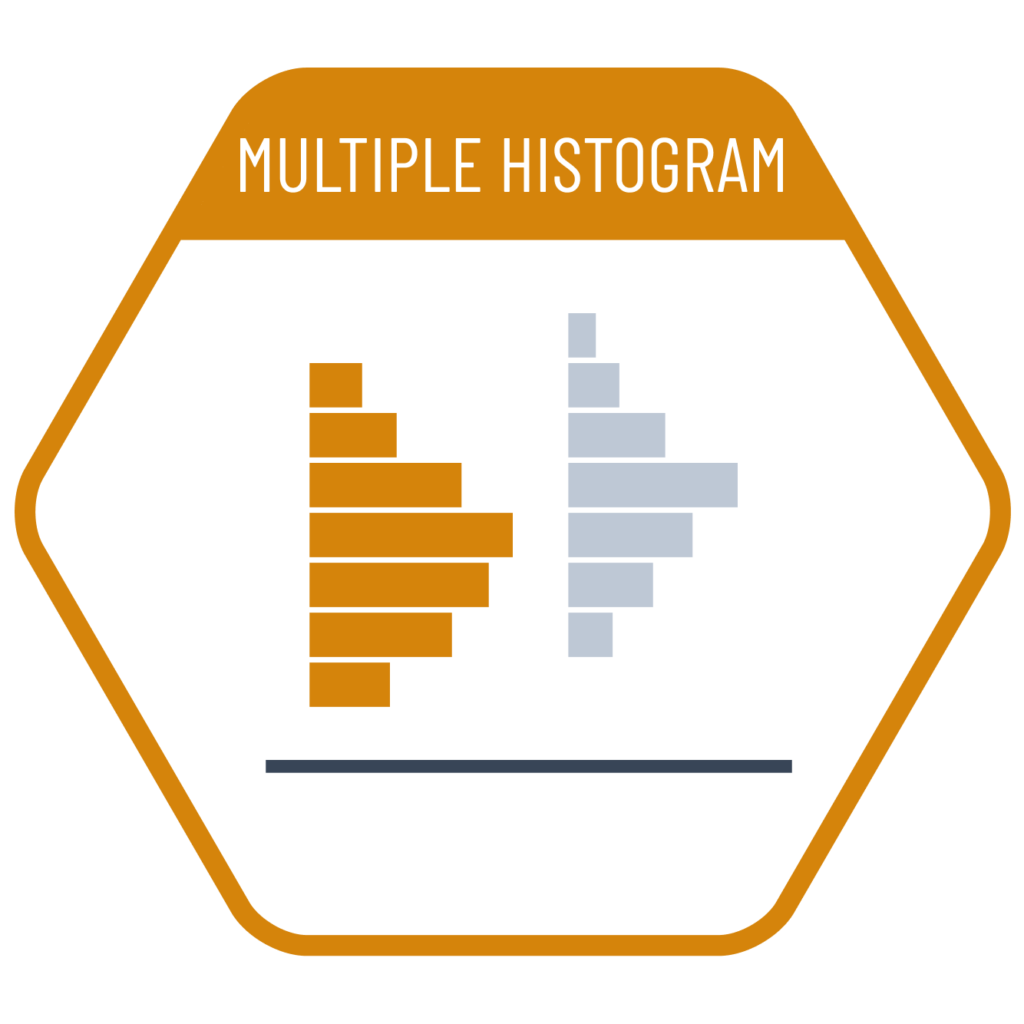
Multiple histograms are a type of chart that can be used to compare the distributions of datasets with categorical breakdowns. In this chart, since the comparison of bar lengths across categories—displayed side by side horizontally—is not visually easy to interpret, it is best used when the distribution of each category is intended to be evaluated individually rather than directly compared to one another.
VISUAL PERFORMANCE CHART
VISUAL CREATION PLATFORMS

Do you have any ideas or examples related to this graphic that you would like to see published here?
Share Here