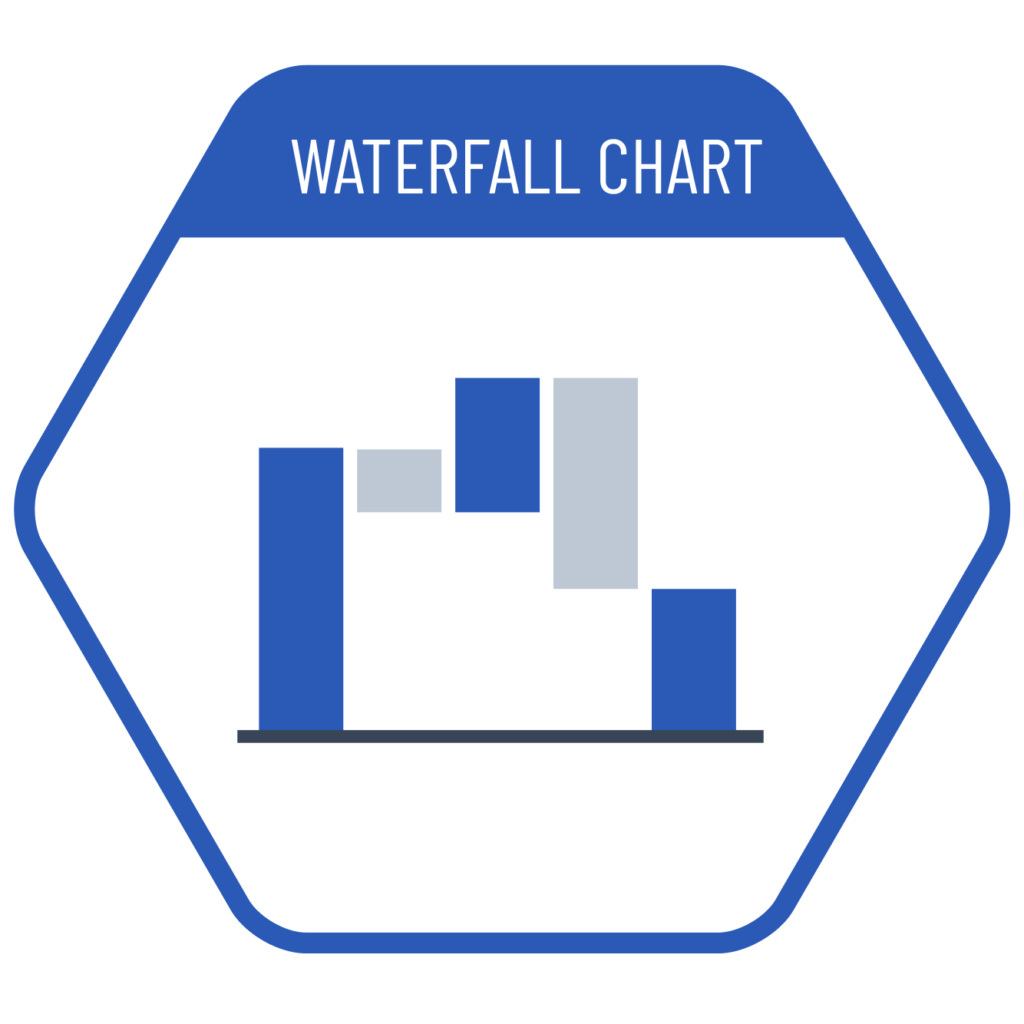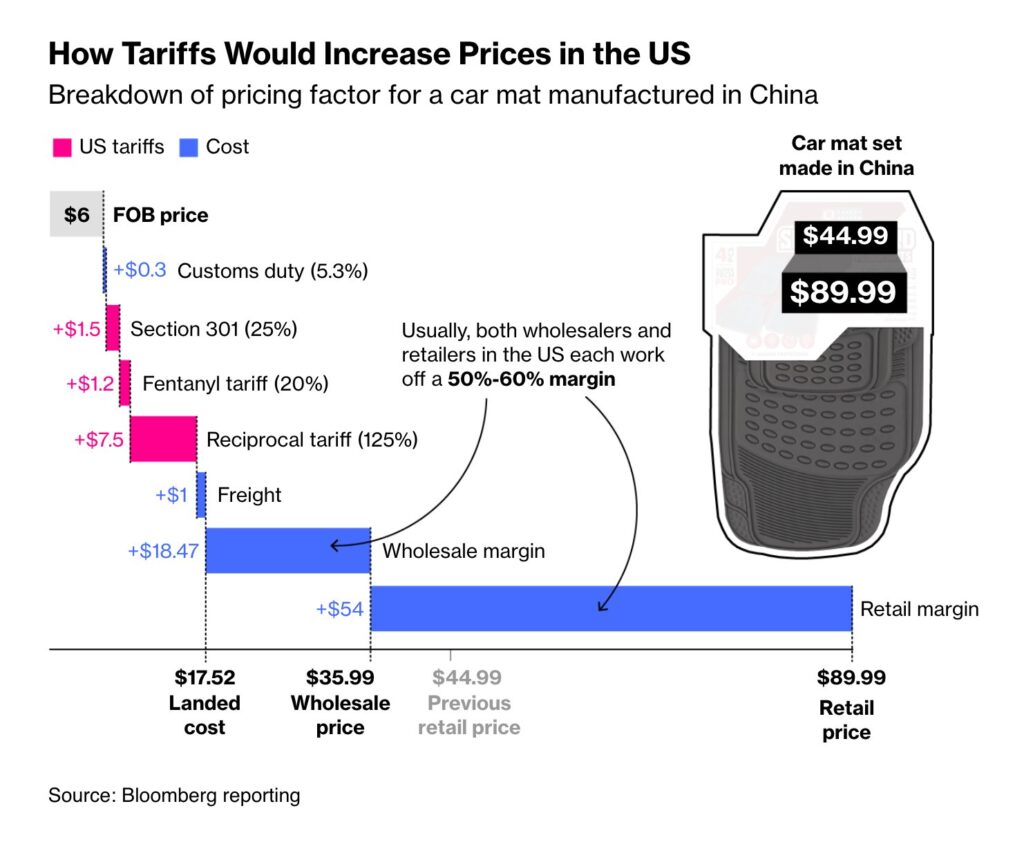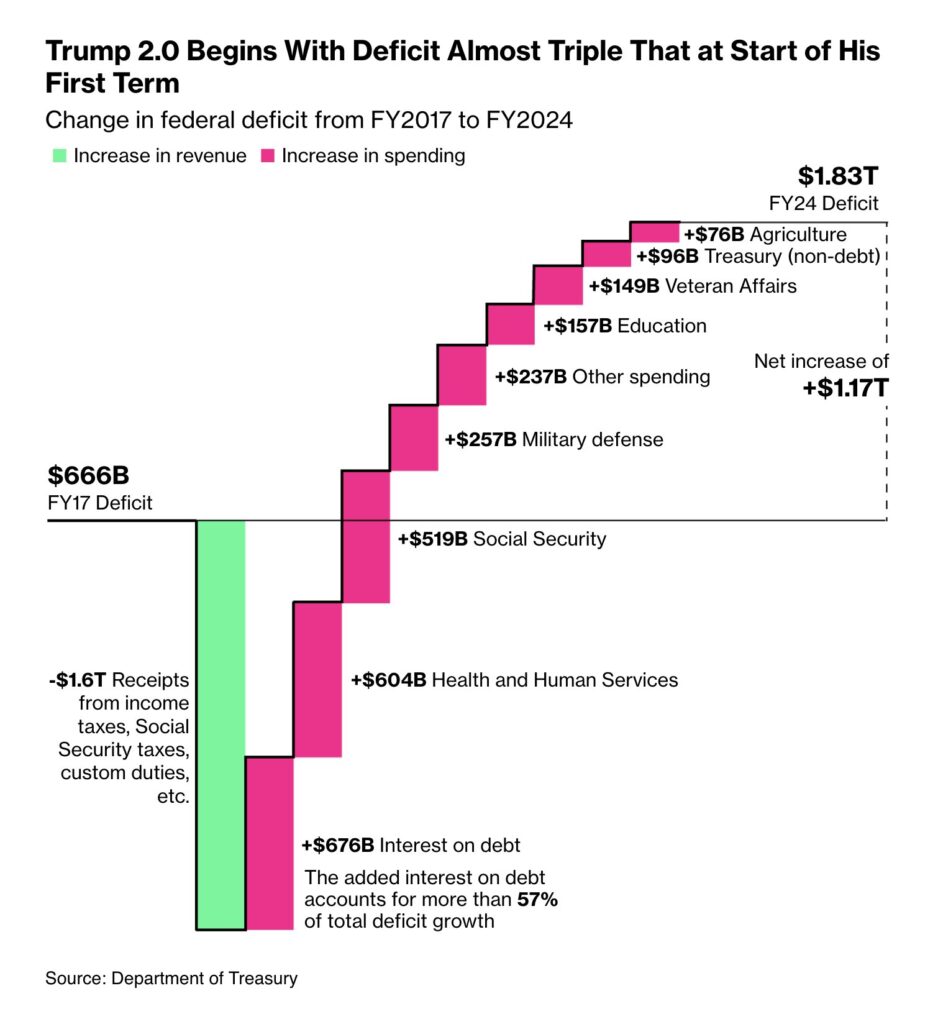
Waterfall charts are a type of connected column chart that visualizes changes over time (deltas) by representing incremental differences. Unlike traditional column charts that display absolute values at each time point starting from zero, waterfall charts always begin from the previous step’s value. As a result, this chart highlights the difference between consecutive values rather than showing the final value at each time step. While waterfall charts can be used to display categorical data, it is beneficial if there is a time dependency between the categories.
VISUAL PERFORMANCE CHART
VISUAL CREATION PLATFORMS

SAMPLE IMAGES
Do you have any ideas or examples related to this graphic that you would like to see published here?
Share Here


