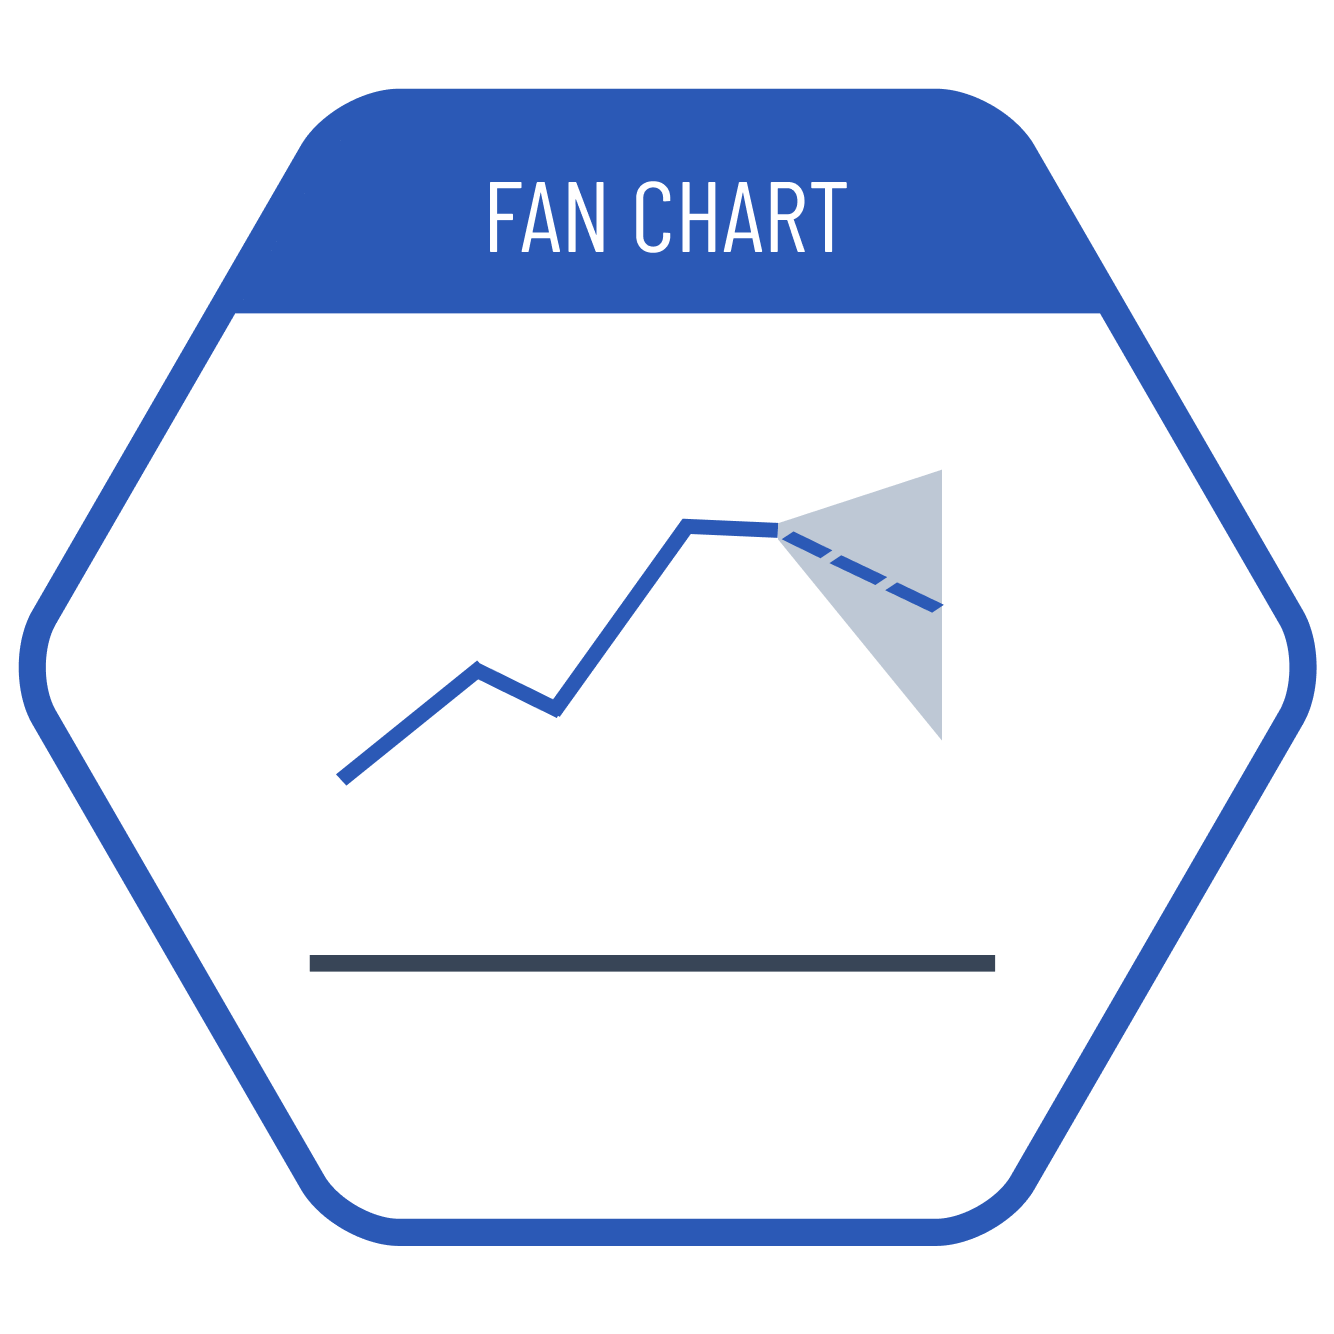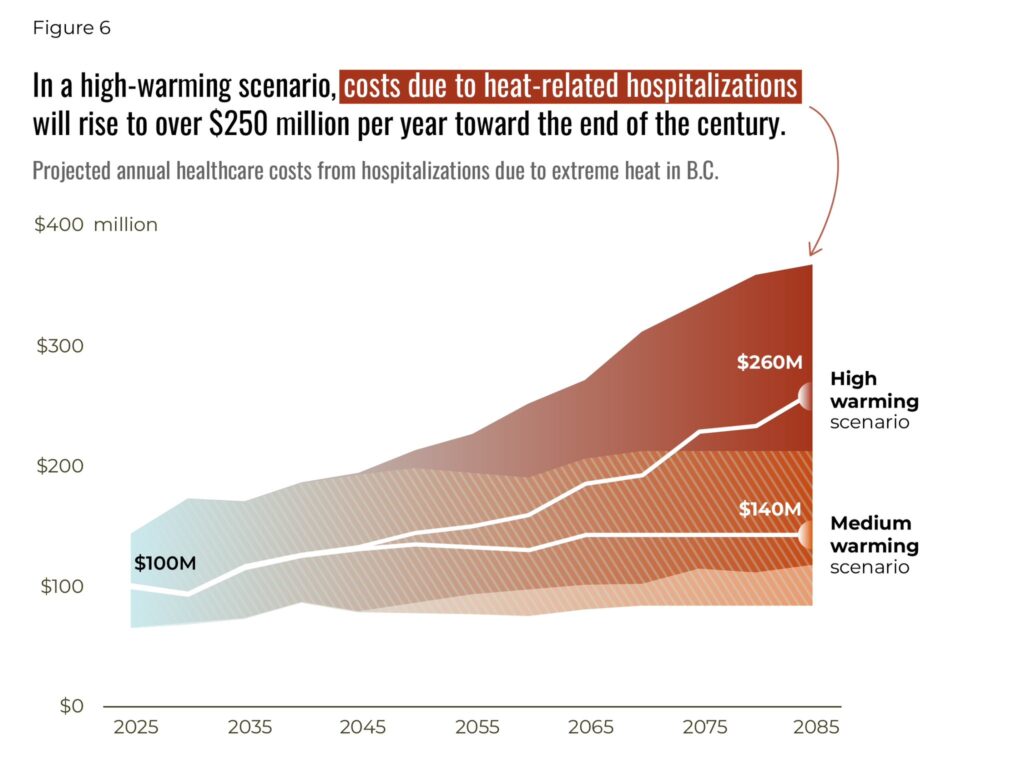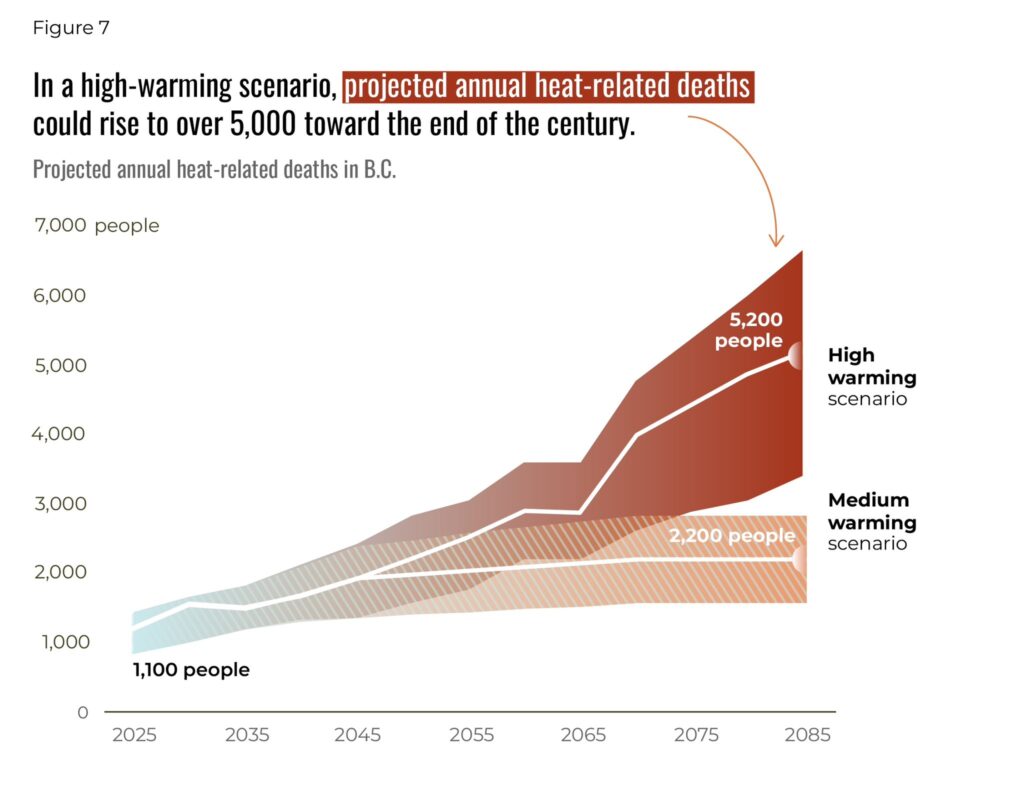
Fan charts are particularly suitable for forecasting. Forecasted future values and trends can be shown with possible upper and lower limits, alongside the historical data behind these forecasts. These upper and lower bounds can be a predefined dataset based on a specific logic, a statistically derived 95% confidence interval, or different categorical values. Therefore, the meaning of these values should always be clearly indicated in the chart.
VISUAL PERFORMANCE CHART
VISUAL CREATION PLATFORMS

SAMPLE IMAGES
Do you have any ideas or examples related to this graphic that you would like to see published here?
Share Here

