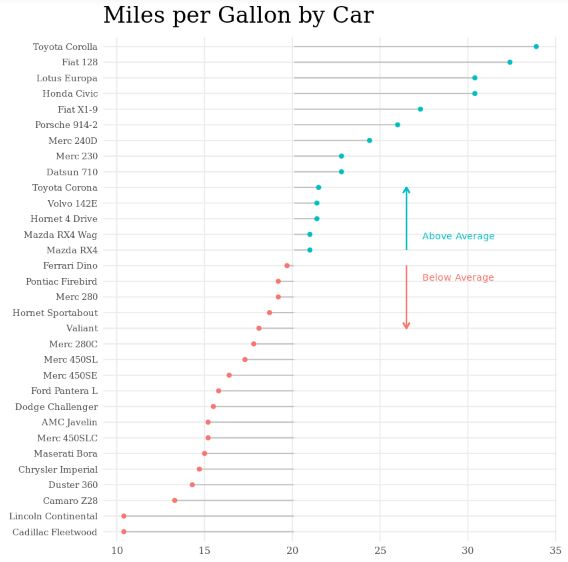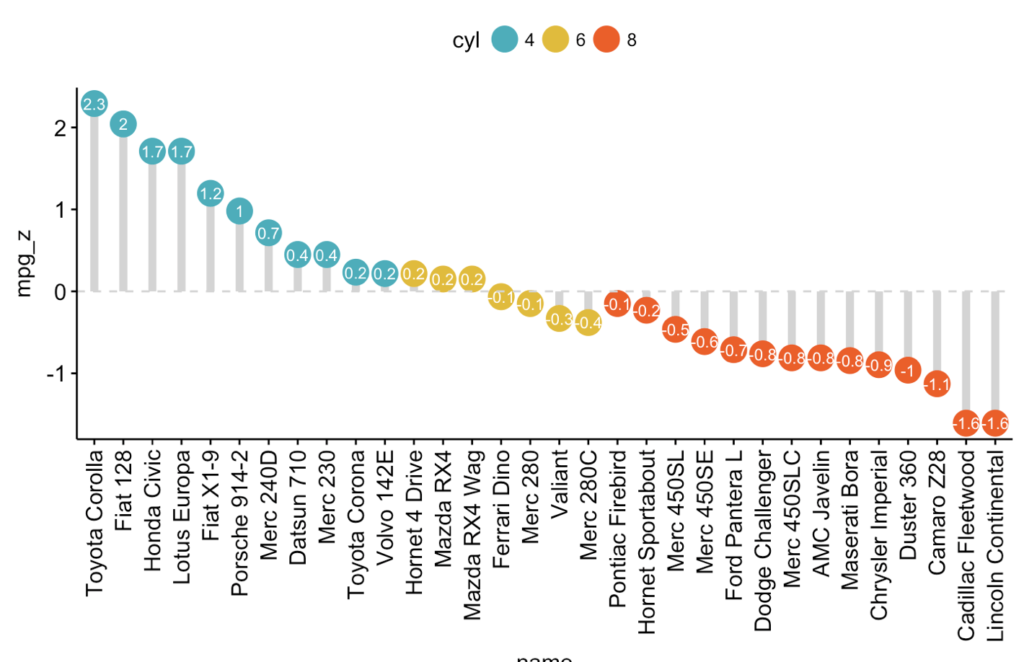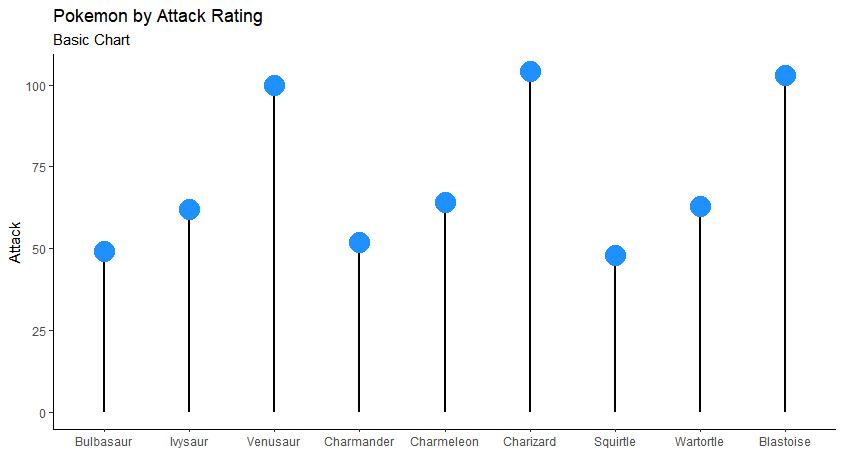
Lollipop charts are the best alternative to column and bar charts. Visual comparisons become difficult when the number of data points increases and/or bars start to take up too much space on the chart due to high data values. In these cases, lollipop charts are a useful solution to save space. For scenarios with numerous categories, horizontal lollipops are more suitable, while vertical ones are better for time series data.
VISUAL PERFORMANCE CHART
VISUAL CREATION PLATFORMS

SAMPLE IMAGES
Do you have any ideas or examples related to this graphic that you would like to see published here?
Share Here


