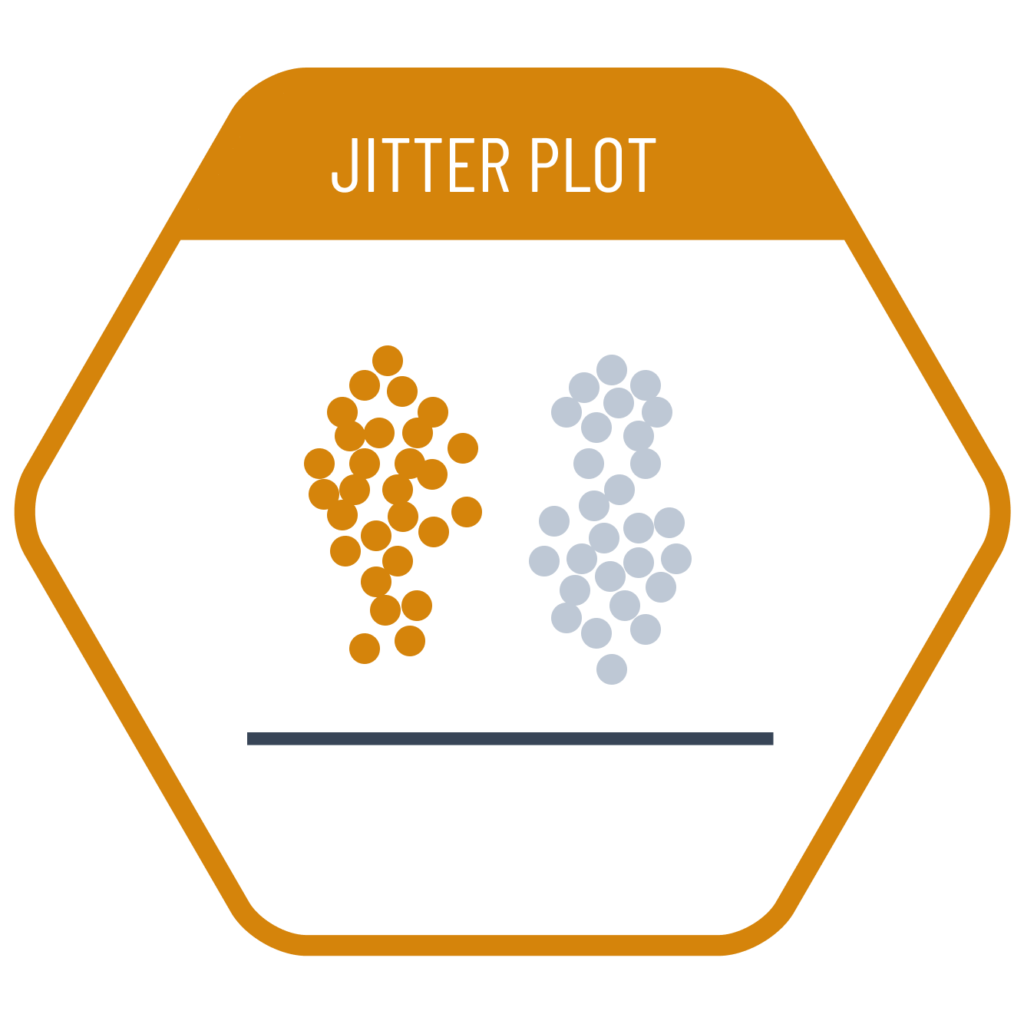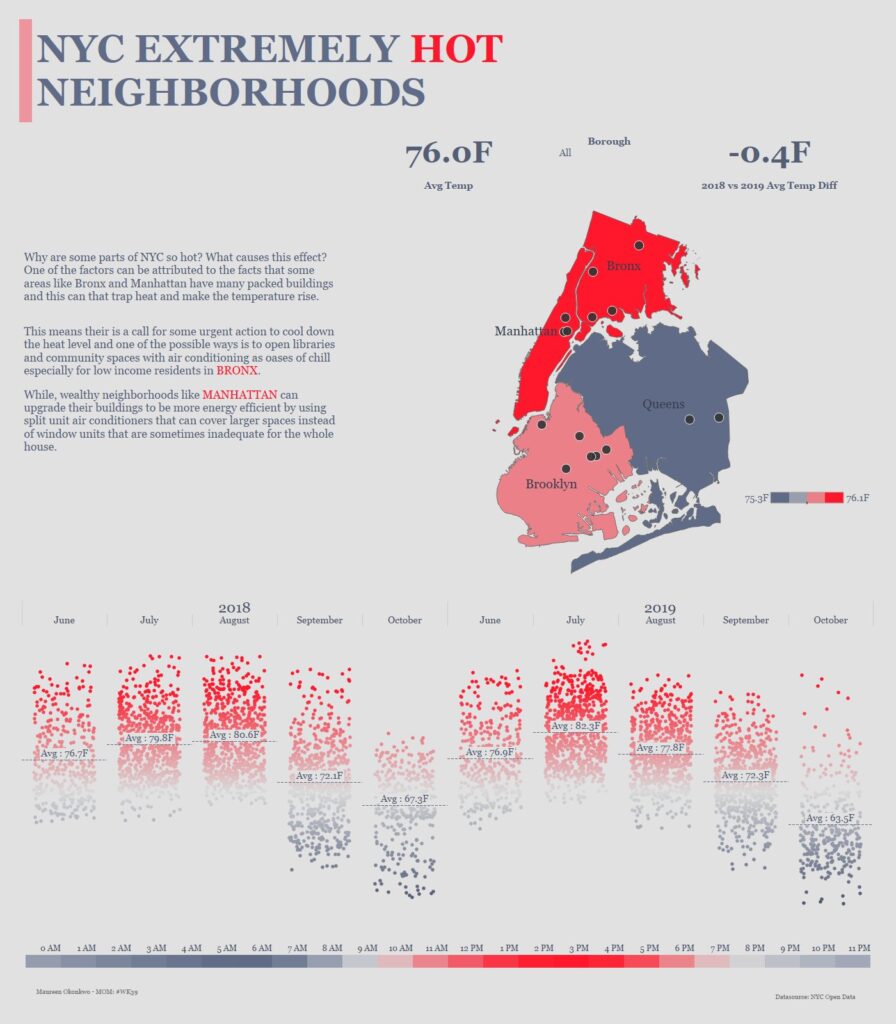
Jitter plots can be considered a variation of dot plots. In datasets where many data points have very similar or identical values and would otherwise overlap, the points are randomly displaced along the categorical axis (horizontal or vertical). The key difference from standard dot plots is that this random jitter prevents data points from stacking directly on top of each other, making dense areas easier to interpret.
VISUAL PERFORMANCE CHART
VISUAL CREATION PLATFORMS

SAMPLE IMAGES
Do you have any ideas or examples related to this graphic that you would like to see published here?
Share Here
